
- Title
-
ICAM1 (CD54) Contributes to the Metastatic Capacity of Gastric Cancer Stem Cells
- Authors
- Tinajero-Rodríguez, J.M., Ramírez-Vidal, L., Becerril-Rico, J., Alvarado-Ortiz, E., Romero-Rodríguez, D.P., López-Casillas, F., Hernández-Sotelo, D., Fernández-Ramírez, F., Contreras-Paredes, A., Ortiz-Sánchez, E.
- Source
- Full text @ Int. J. Mol. Sci.
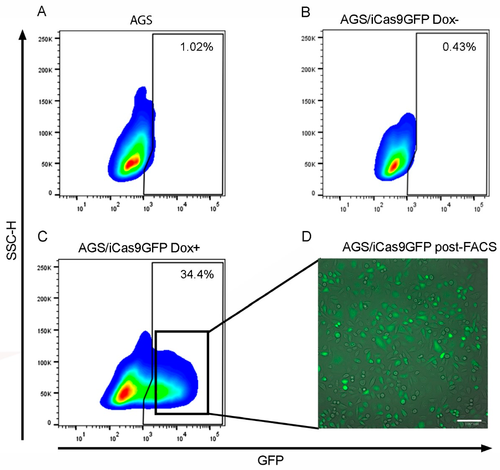
The generation of an AGS/iCas9GFP cell line. (A) GFP basal expression in the AGS cell line. (B) GFP expression in the AGS/iCas9GFP cell line Dox−. (C) GFP expression in the AGS/iCas9GFP cell line after inducing with Dox+. (D) The fluorescence microscopy of the AGS/iCas9GFP cell lines after FACS, 20x. Dox+ and Dox−, with or without doxycycline, respectively. Bars indicate 100 µm. |

GCSC/ICAM1KO transduction efficiency 48 h post-induction. (A) AGS/iCas9GFP transduced with sgRNA-SCR Dox+. (B) AGS/iCas9GFP transduced with ICAM1-sgRNA 1/2 Dox−. (C) AGS/iCas9GFP transduced with ICAM1-sgRNA 1/2 Dox+. (D) Merge between blot B (red population) and blot C (blue population) panels. Dox (doxycycline). |
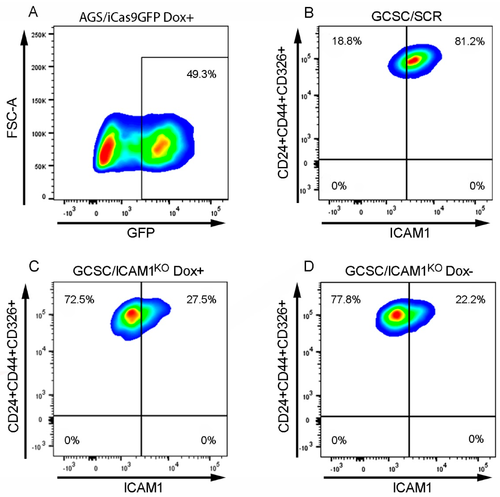
The CRISPRiCas9 generation of a stable GCSC/ICAM1KO cell line. (A) GFP expression in AGS/iCas9GFP Dox+ cells. (B) GCSC/SCR Dox+. (C) GCSC/ICAM1KO Dox+. (D) GCSC/ICAM1KO Dox−. The panels represent pass 10 after cell sorting with the respective immunophenotype. Dox (doxycycline). |
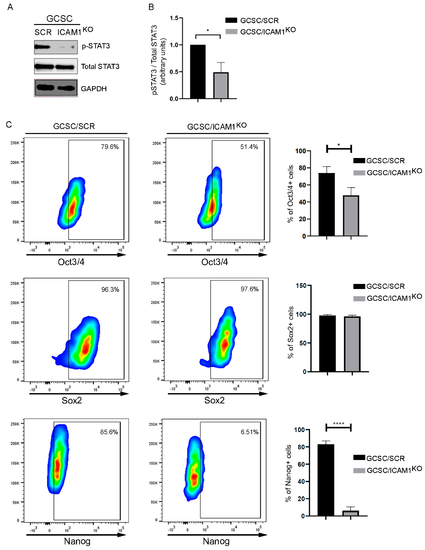
Regulation of stemness-related transcription factor expression by ICAM1/STAT3 axis. (A) Western blot analysis of total lysates of GCSC/ICAM1KO and GCSC/SCR cells demonstrated diminished levels of phosphor-STAT3 (p-STAT3-ser727) in GCSC/ICAM1KO cells. (B) Densitometry of Western blot * p < 0.05. (C) Representative dot plot of cytometry flow analysis; GCSC/ICAM1KO cells reduced expression of stem cell markers Oct3/4 and Nanog but not Sox2. * p < 0.05. **** p < 0.0001. |
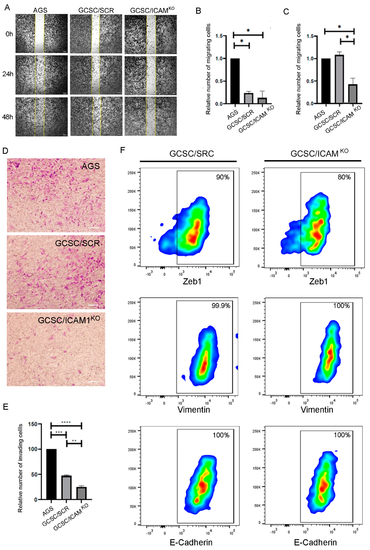
GCSC/ICAM1KO cells lost their ability to migrate and invade but did not alter the expression of EMT markers. (A) Representative images of the migration assay; GCSC/ICAM1KO cells exhibited a decreased ability to migrate at 24 h and 48 h, 4X. Bars indicate 200 µm. (B,C) A quantitative analysis of the relative number of migrating cells represented in (A) at 24 (B) and 48 h (C); n = 3 per group. (D) Representative images of the invasion assay; GCSC/ICAM1KO cells exhibited a decreased ability to invade at 24 h, 20X. Bars indicate 100 µm. (E) A quantitative analysis of the invasion assay. The values represent the mean ± SD of three independent experiments and are expressed in relative percentages. Asterisks indicate the comparison made between groups. * p < 0.05, ** p < 0.01, *** p < 0.001, and **** p < 0.0001. (F) A representative dot plot showing the effect of ICAM1 deletion on the expression level of EMT-related proteins. |
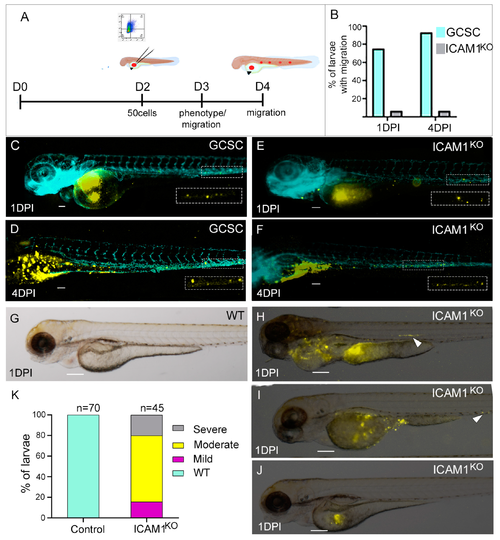
The tumorigenic and migratory capabilities of xenotransplanted GCSC/ICAM1KO cells. (A) The experimental design. (B) The percentage of embryos with migrating GCSCs or GCSC/ICAM1KO cells after 1 and 4 dpi. (C,D) show larvae injected with GCSCs after 1 or 4 dpi, respectively. (E,F) show larvae injected with GCSC/ICAM1KO cells after 1 or 4 dpi, respectively. (H–J) show larvae after 1 dpi with severe, moderate, or mild phenotypes, respectively. (G) shows a wild-type larva. (K) shows the percentage of larvae with severe, moderate, or mild phenotypes (n = 45). The images were obtained with a Nikon SMZ1500 stereomicroscope. All the bars indicate 100 µm. GCSC = AGS/GCSC, and ICAM1KO = GCSC/ICAM1KO. All boxes and arrow heads indicate sites with migrating cells. |
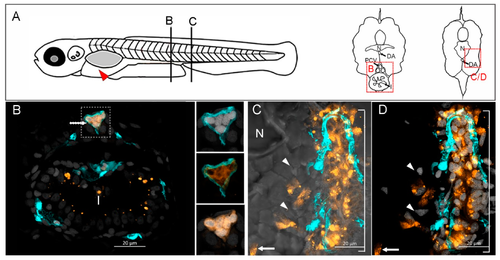
GCSCs migrate in groups and establish metastatic tumors. (A) Tg (fli1:EGFP)y1 zebrafish embryos (2 dpf) were given an injection into the yolk sac (red arrow) of 50 fluorescently observed migrating cells (white arrow) inside the posterior cardinal vein (PCV, cyan) over the distal portion of the intestine (I). The insets show five GCSC nuclei inside the PCV, co-stained with Hoechst (white). (C,D) The GCSCs formed a metastatic cell mass that invaded the skeletal muscle at the level of somites 21-21, as observed using a brightfield microscope (C), the nuclei were stained with Hoescht (D) to observe clearly the cell mass. The white arrows show GCSCs, and the white arrowheads indicate zebrafish muscle fiber nuclei. N indicates the notochord, DA the dorsal aorta, and I the intestine. The images were obtained at 63X with an LSM800 confocal microscope. Labeled GCSCs are shown in orange, and 6 µm sections are shown in the (B,C) insets. (B) GCSCs 6 dpi. |
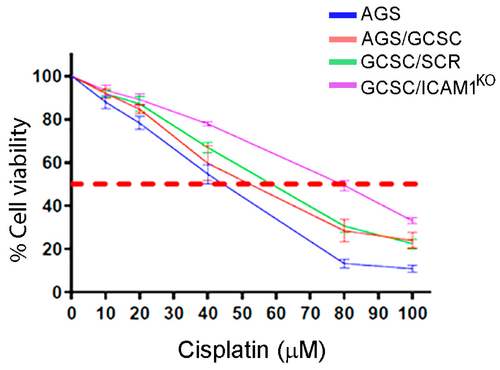
GCSC/ICAM1KO cells exhibited an increased resistance to cisplatin. Viability percentages are shown for AGS (IC50 at 41.6 µM), AGS-GCSC (IC50 at 49.3 µM), GCSC-SCR (IC50 at 55.08 µM), and GCSC-ICAM1KO (IC50 at 79.2 µM) cells in the presence of different concentrations of cisplatin. n = data from 3 independent assays. The dotted line means the 50% of cell viability. |