
Image
|
Figure Caption
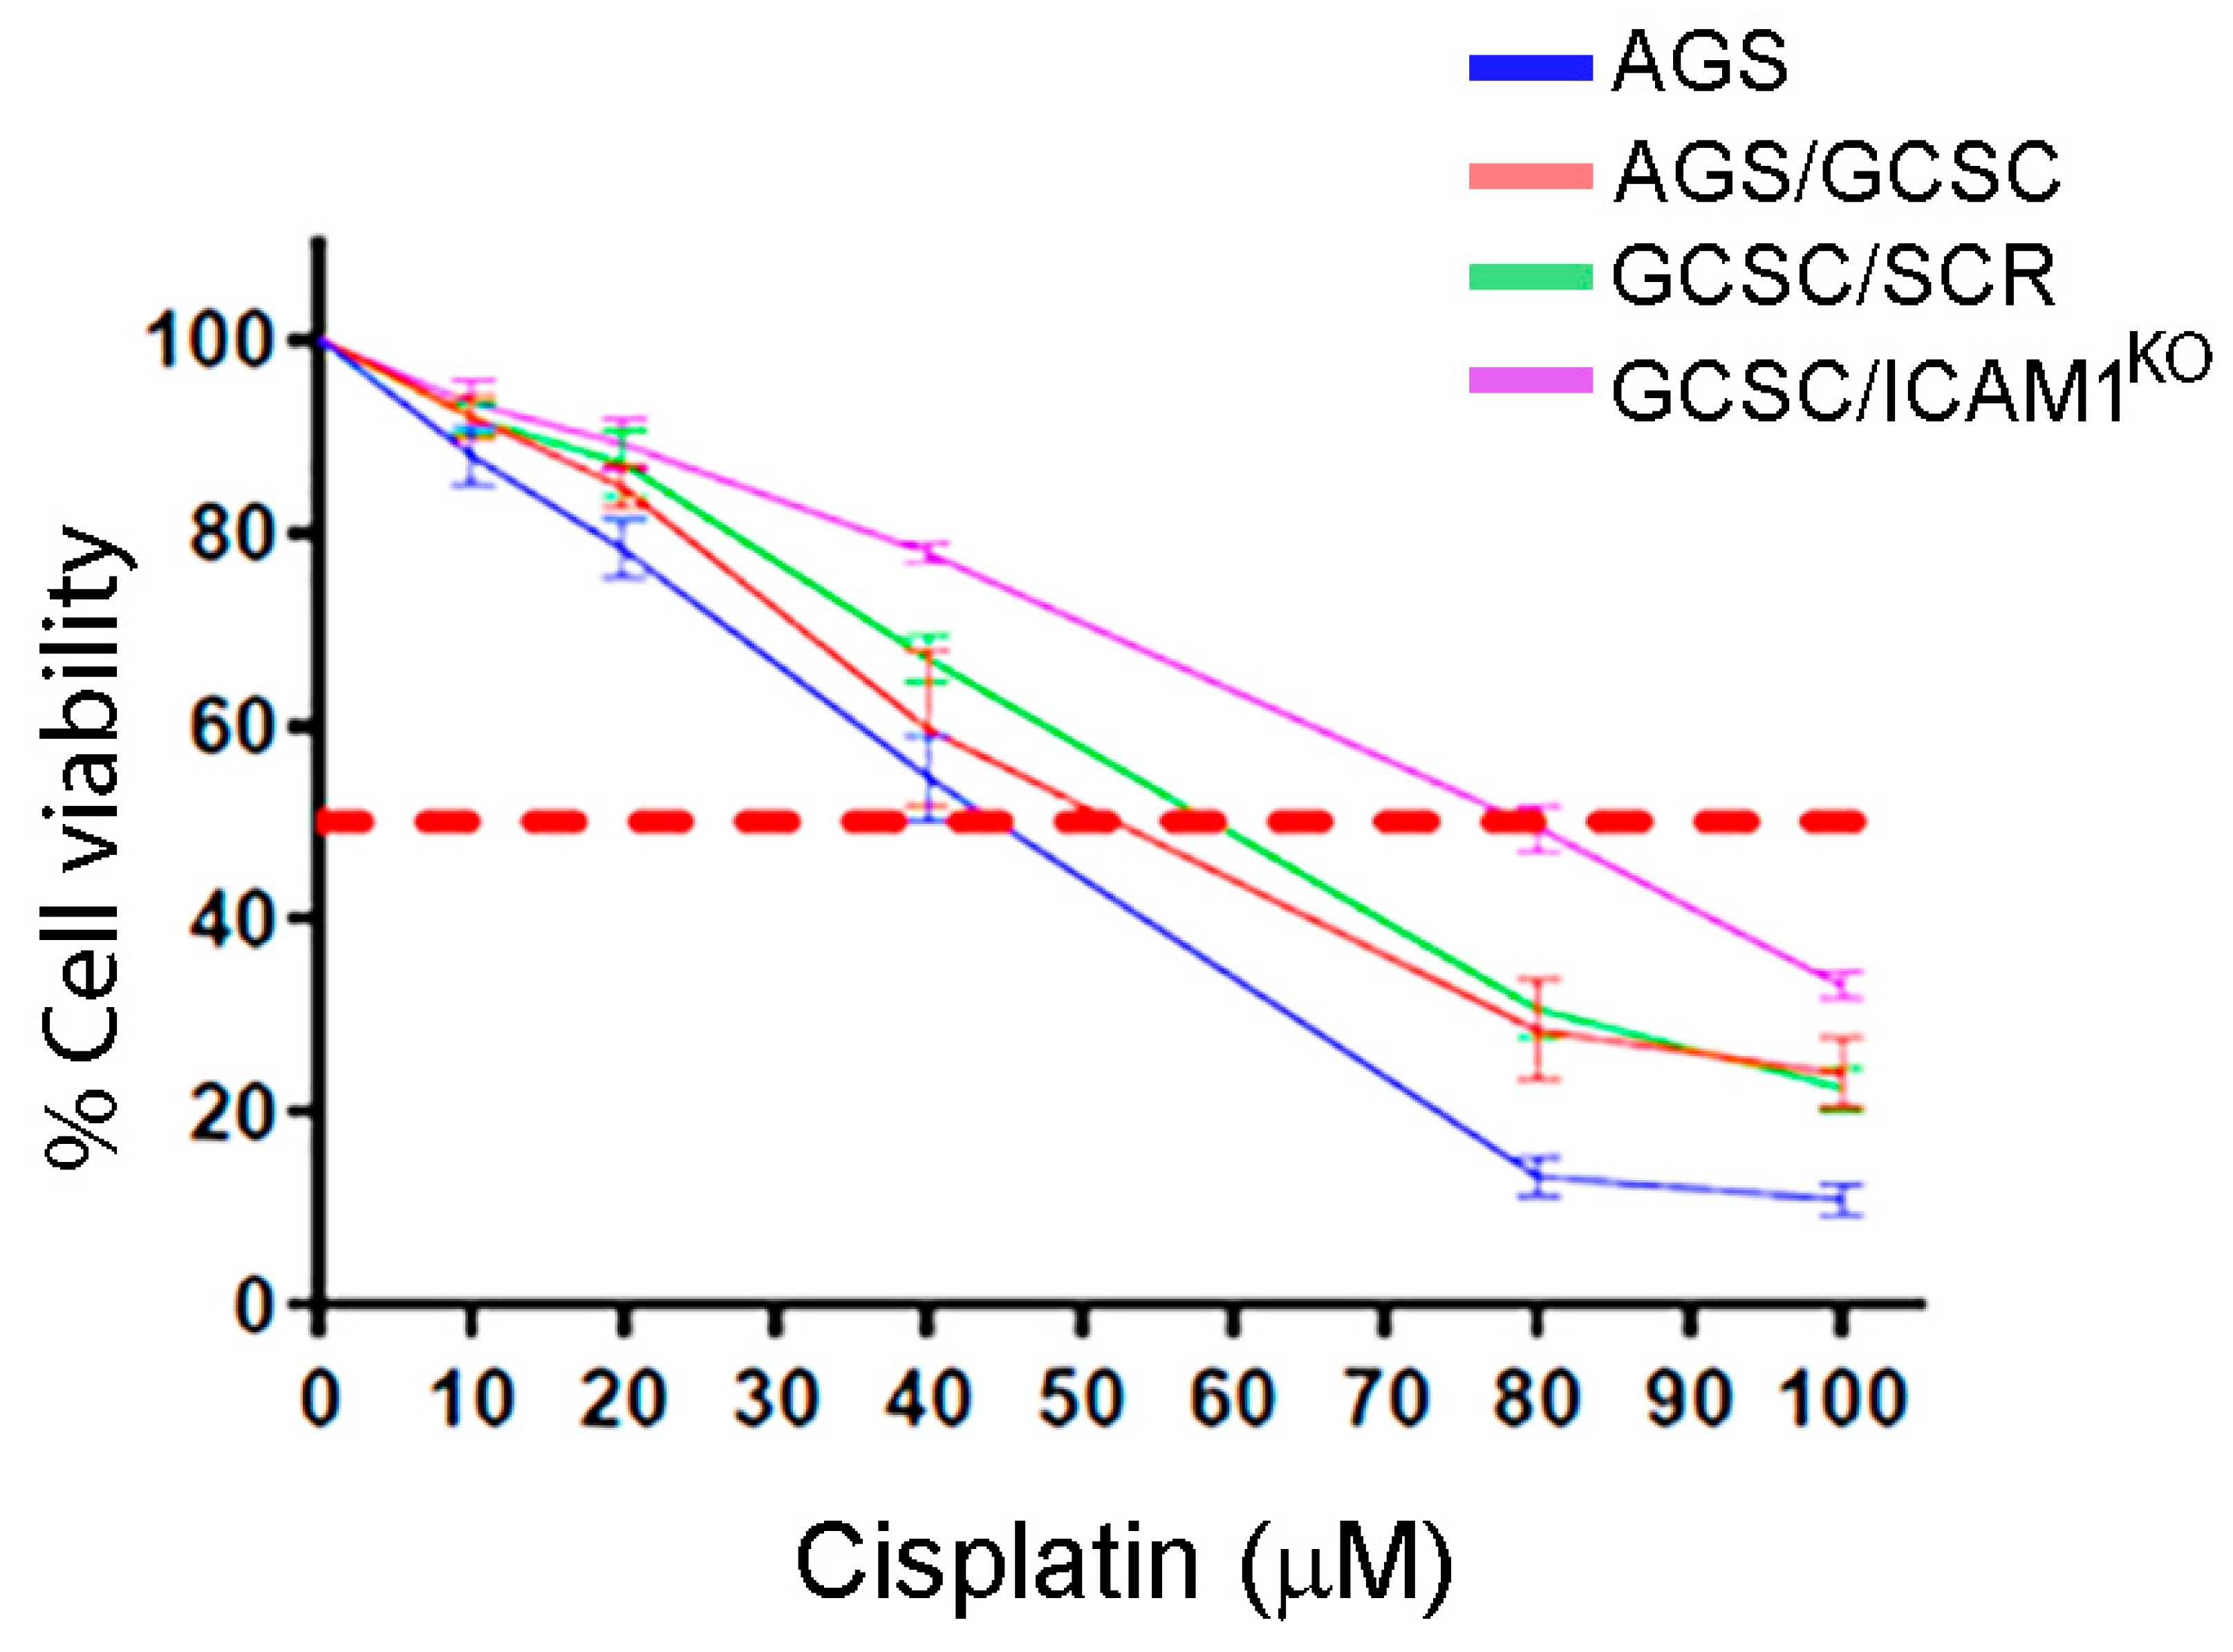
Fig. 8 GCSC/ICAM1KO cells exhibited an increased resistance to cisplatin. Viability percentages are shown for AGS (IC50 at 41.6 µM), AGS-GCSC (IC50 at 49.3 µM), GCSC-SCR (IC50 at 55.08 µM), and GCSC-ICAM1KO (IC50 at 79.2 µM) cells in the presence of different concentrations of cisplatin. n = data from 3 independent assays. The dotted line means the 50% of cell viability.
Acknowledgments
This image is the copyrighted work of the attributed author or publisher, and
ZFIN has permission only to display this image to its users.
Additional permissions should be obtained from the applicable author or publisher of the image.
Full text @ Int. J. Mol. Sci.