
|
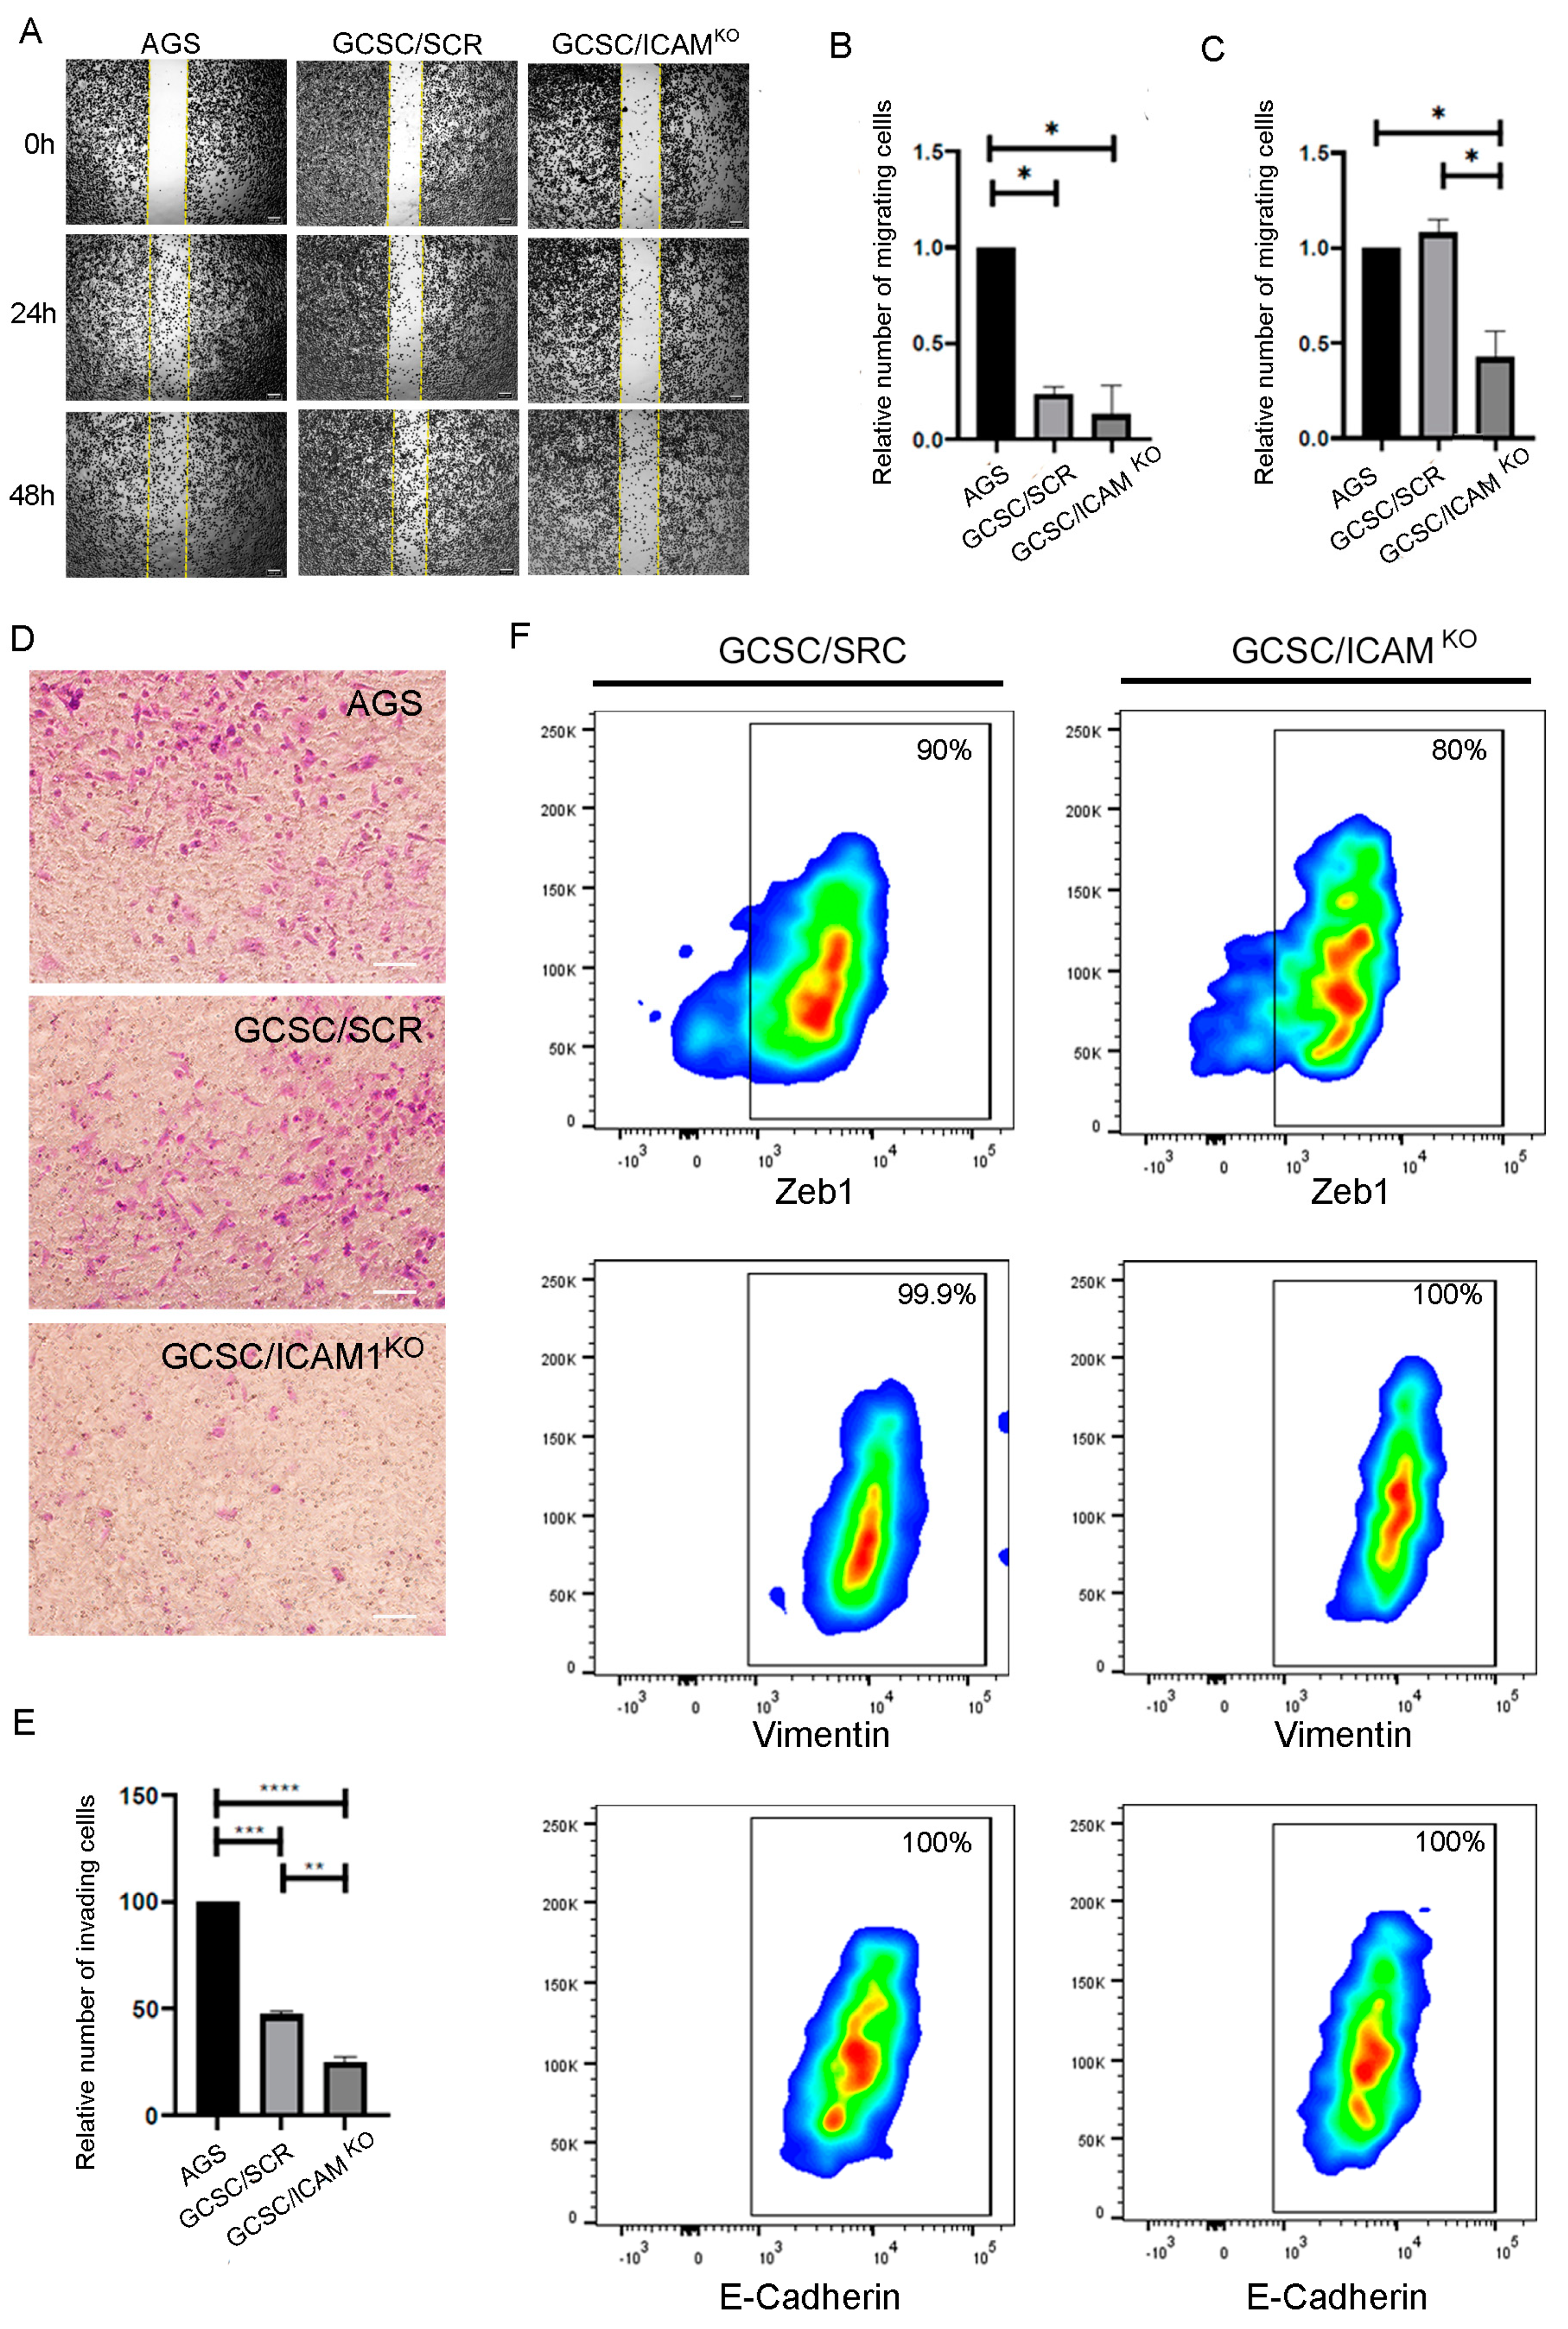
Fig. 5 GCSC/ICAM1KO cells lost their ability to migrate and invade but did not alter the expression of EMT markers. (A) Representative images of the migration assay; GCSC/ICAM1KO cells exhibited a decreased ability to migrate at 24 h and 48 h, 4X. Bars indicate 200 µm. (B,C) A quantitative analysis of the relative number of migrating cells represented in (A) at 24 (B) and 48 h (C); n = 3 per group. (D) Representative images of the invasion assay; GCSC/ICAM1KO cells exhibited a decreased ability to invade at 24 h, 20X. Bars indicate 100 µm. (E) A quantitative analysis of the invasion assay. The values represent the mean ± SD of three independent experiments and are expressed in relative percentages. Asterisks indicate the comparison made between groups. * p < 0.05, ** p < 0.01, *** p < 0.001, and **** p < 0.0001. (F) A representative dot plot showing the effect of ICAM1 deletion on the expression level of EMT-related proteins.