
Image
|
Figure Caption
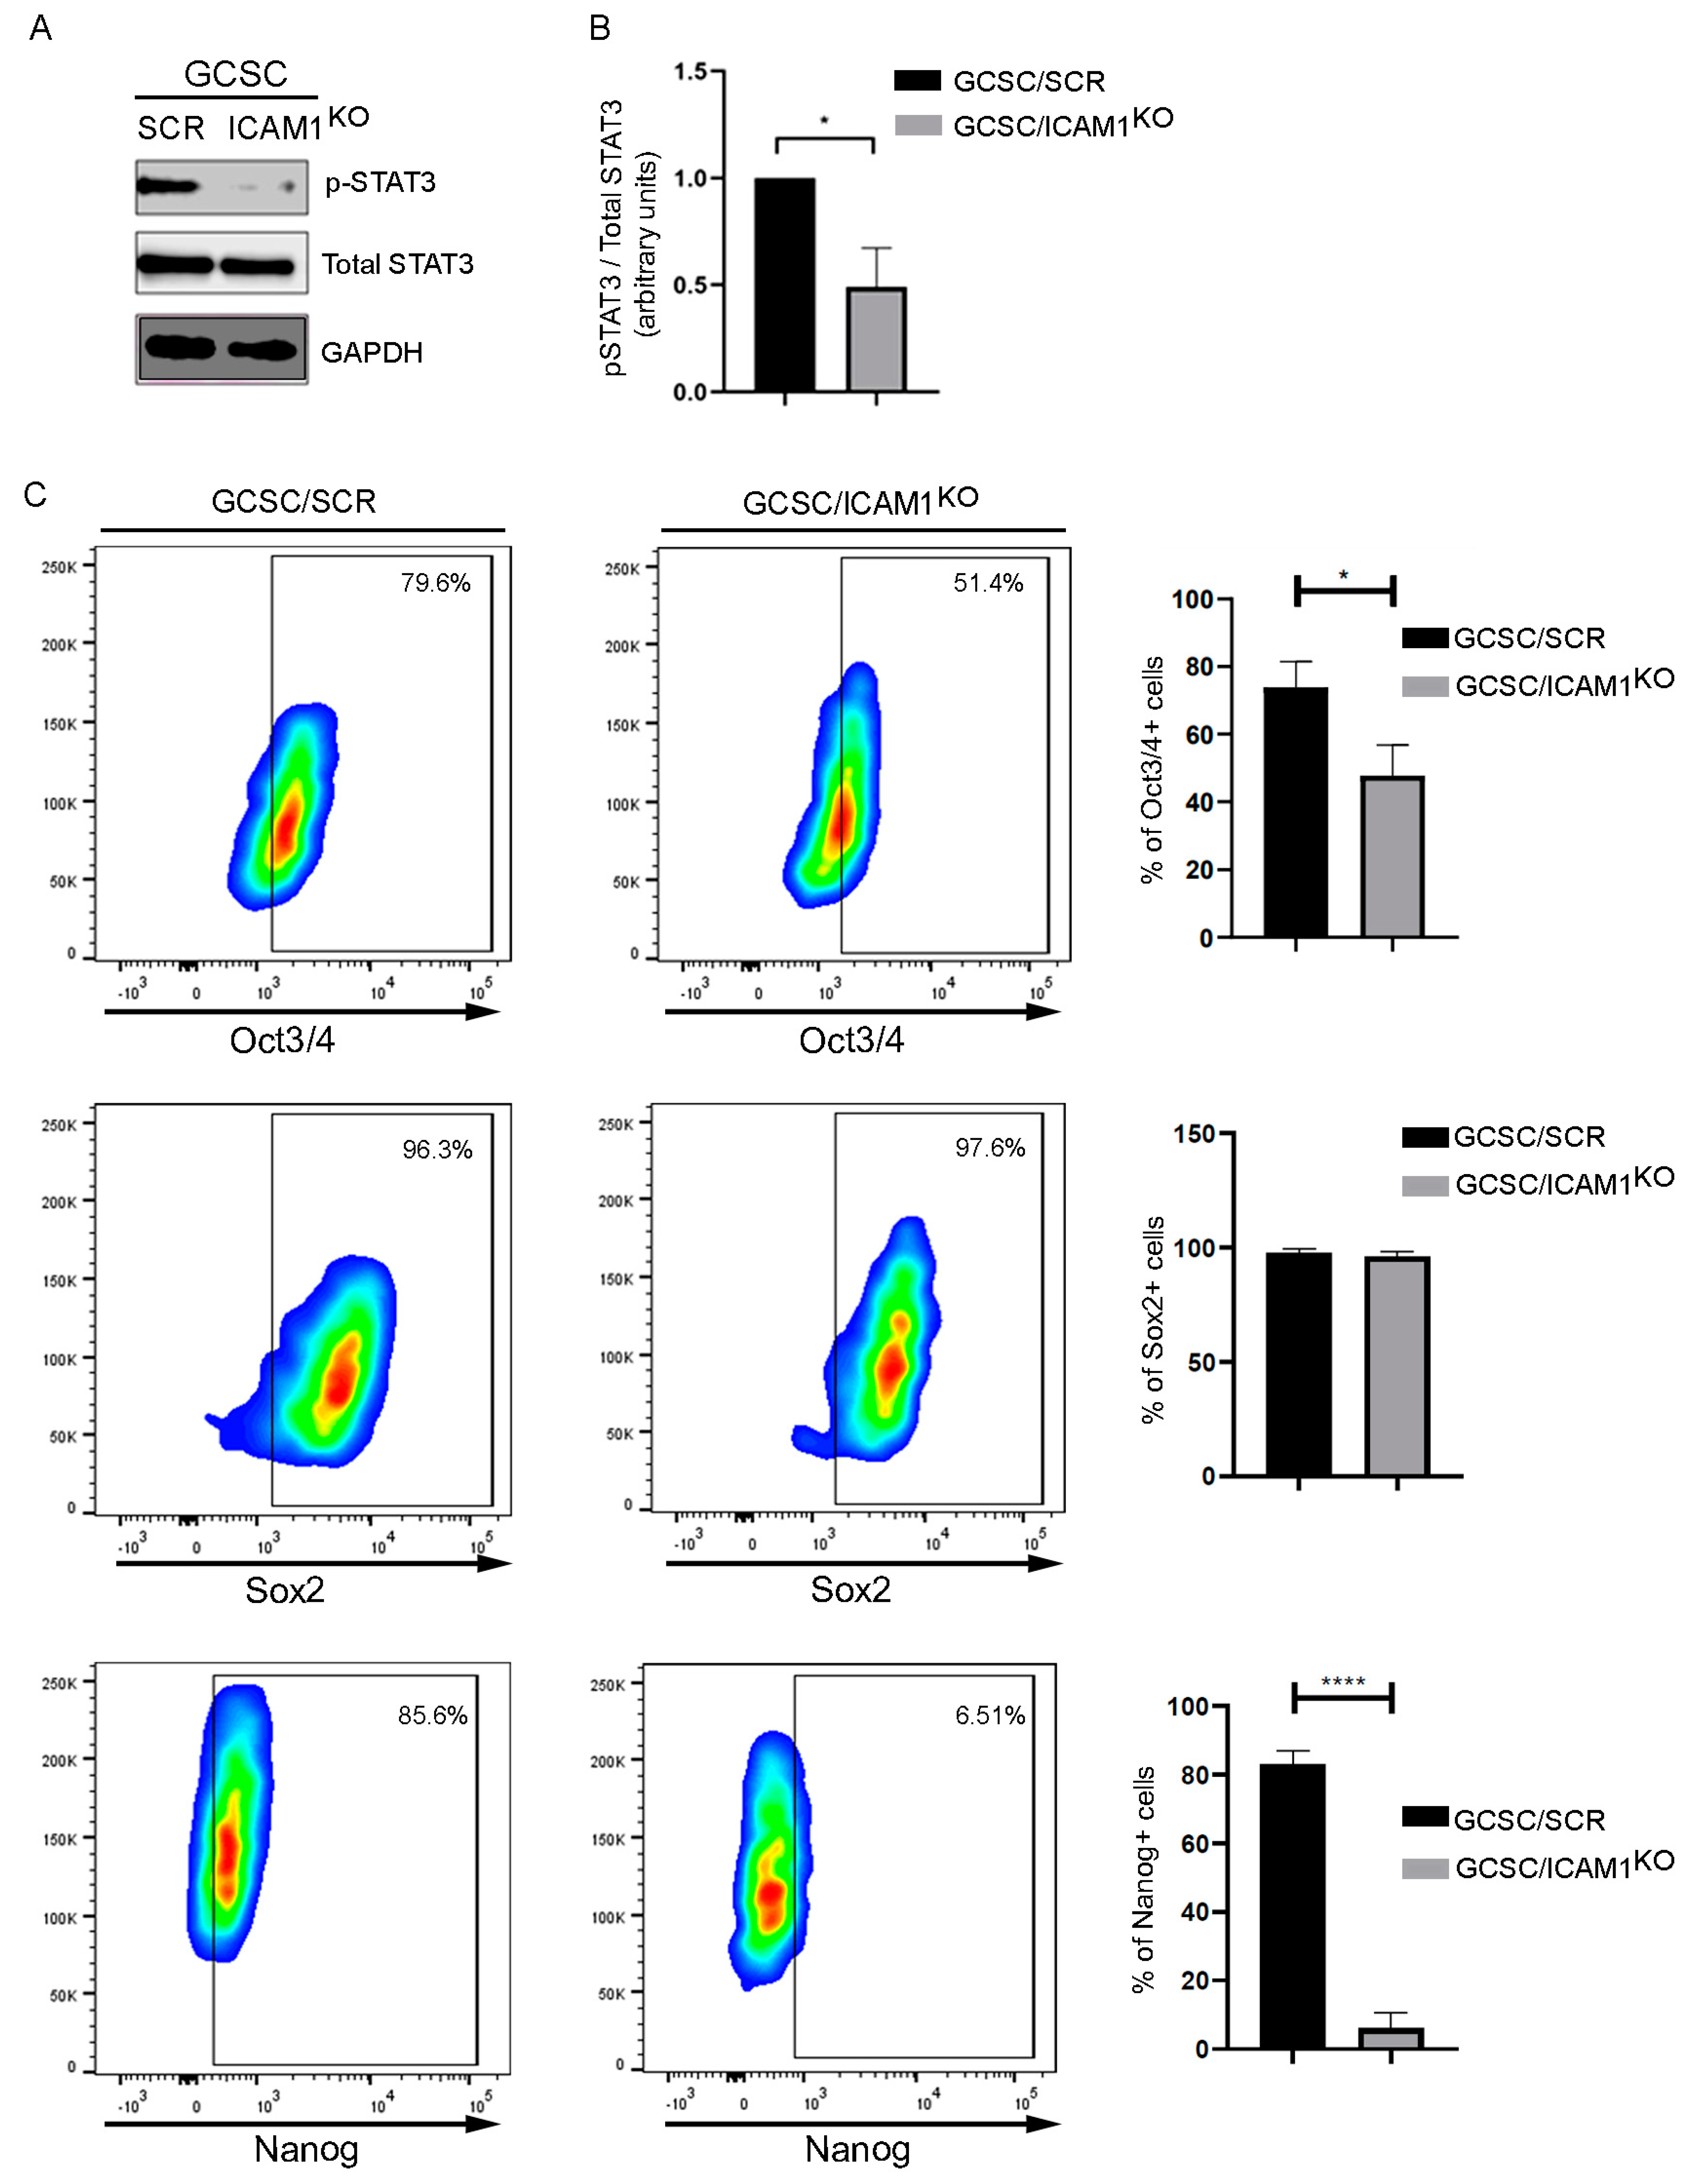
Fig. 4 Regulation of stemness-related transcription factor expression by ICAM1/STAT3 axis. (A) Western blot analysis of total lysates of GCSC/ICAM1KO and GCSC/SCR cells demonstrated diminished levels of phosphor-STAT3 (p-STAT3-ser727) in GCSC/ICAM1KO cells. (B) Densitometry of Western blot * p < 0.05. (C) Representative dot plot of cytometry flow analysis; GCSC/ICAM1KO cells reduced expression of stem cell markers Oct3/4 and Nanog but not Sox2. * p < 0.05. **** p < 0.0001.
Acknowledgments
This image is the copyrighted work of the attributed author or publisher, and
ZFIN has permission only to display this image to its users.
Additional permissions should be obtained from the applicable author or publisher of the image.
Full text @ Int. J. Mol. Sci.