
Image
|
Figure Caption
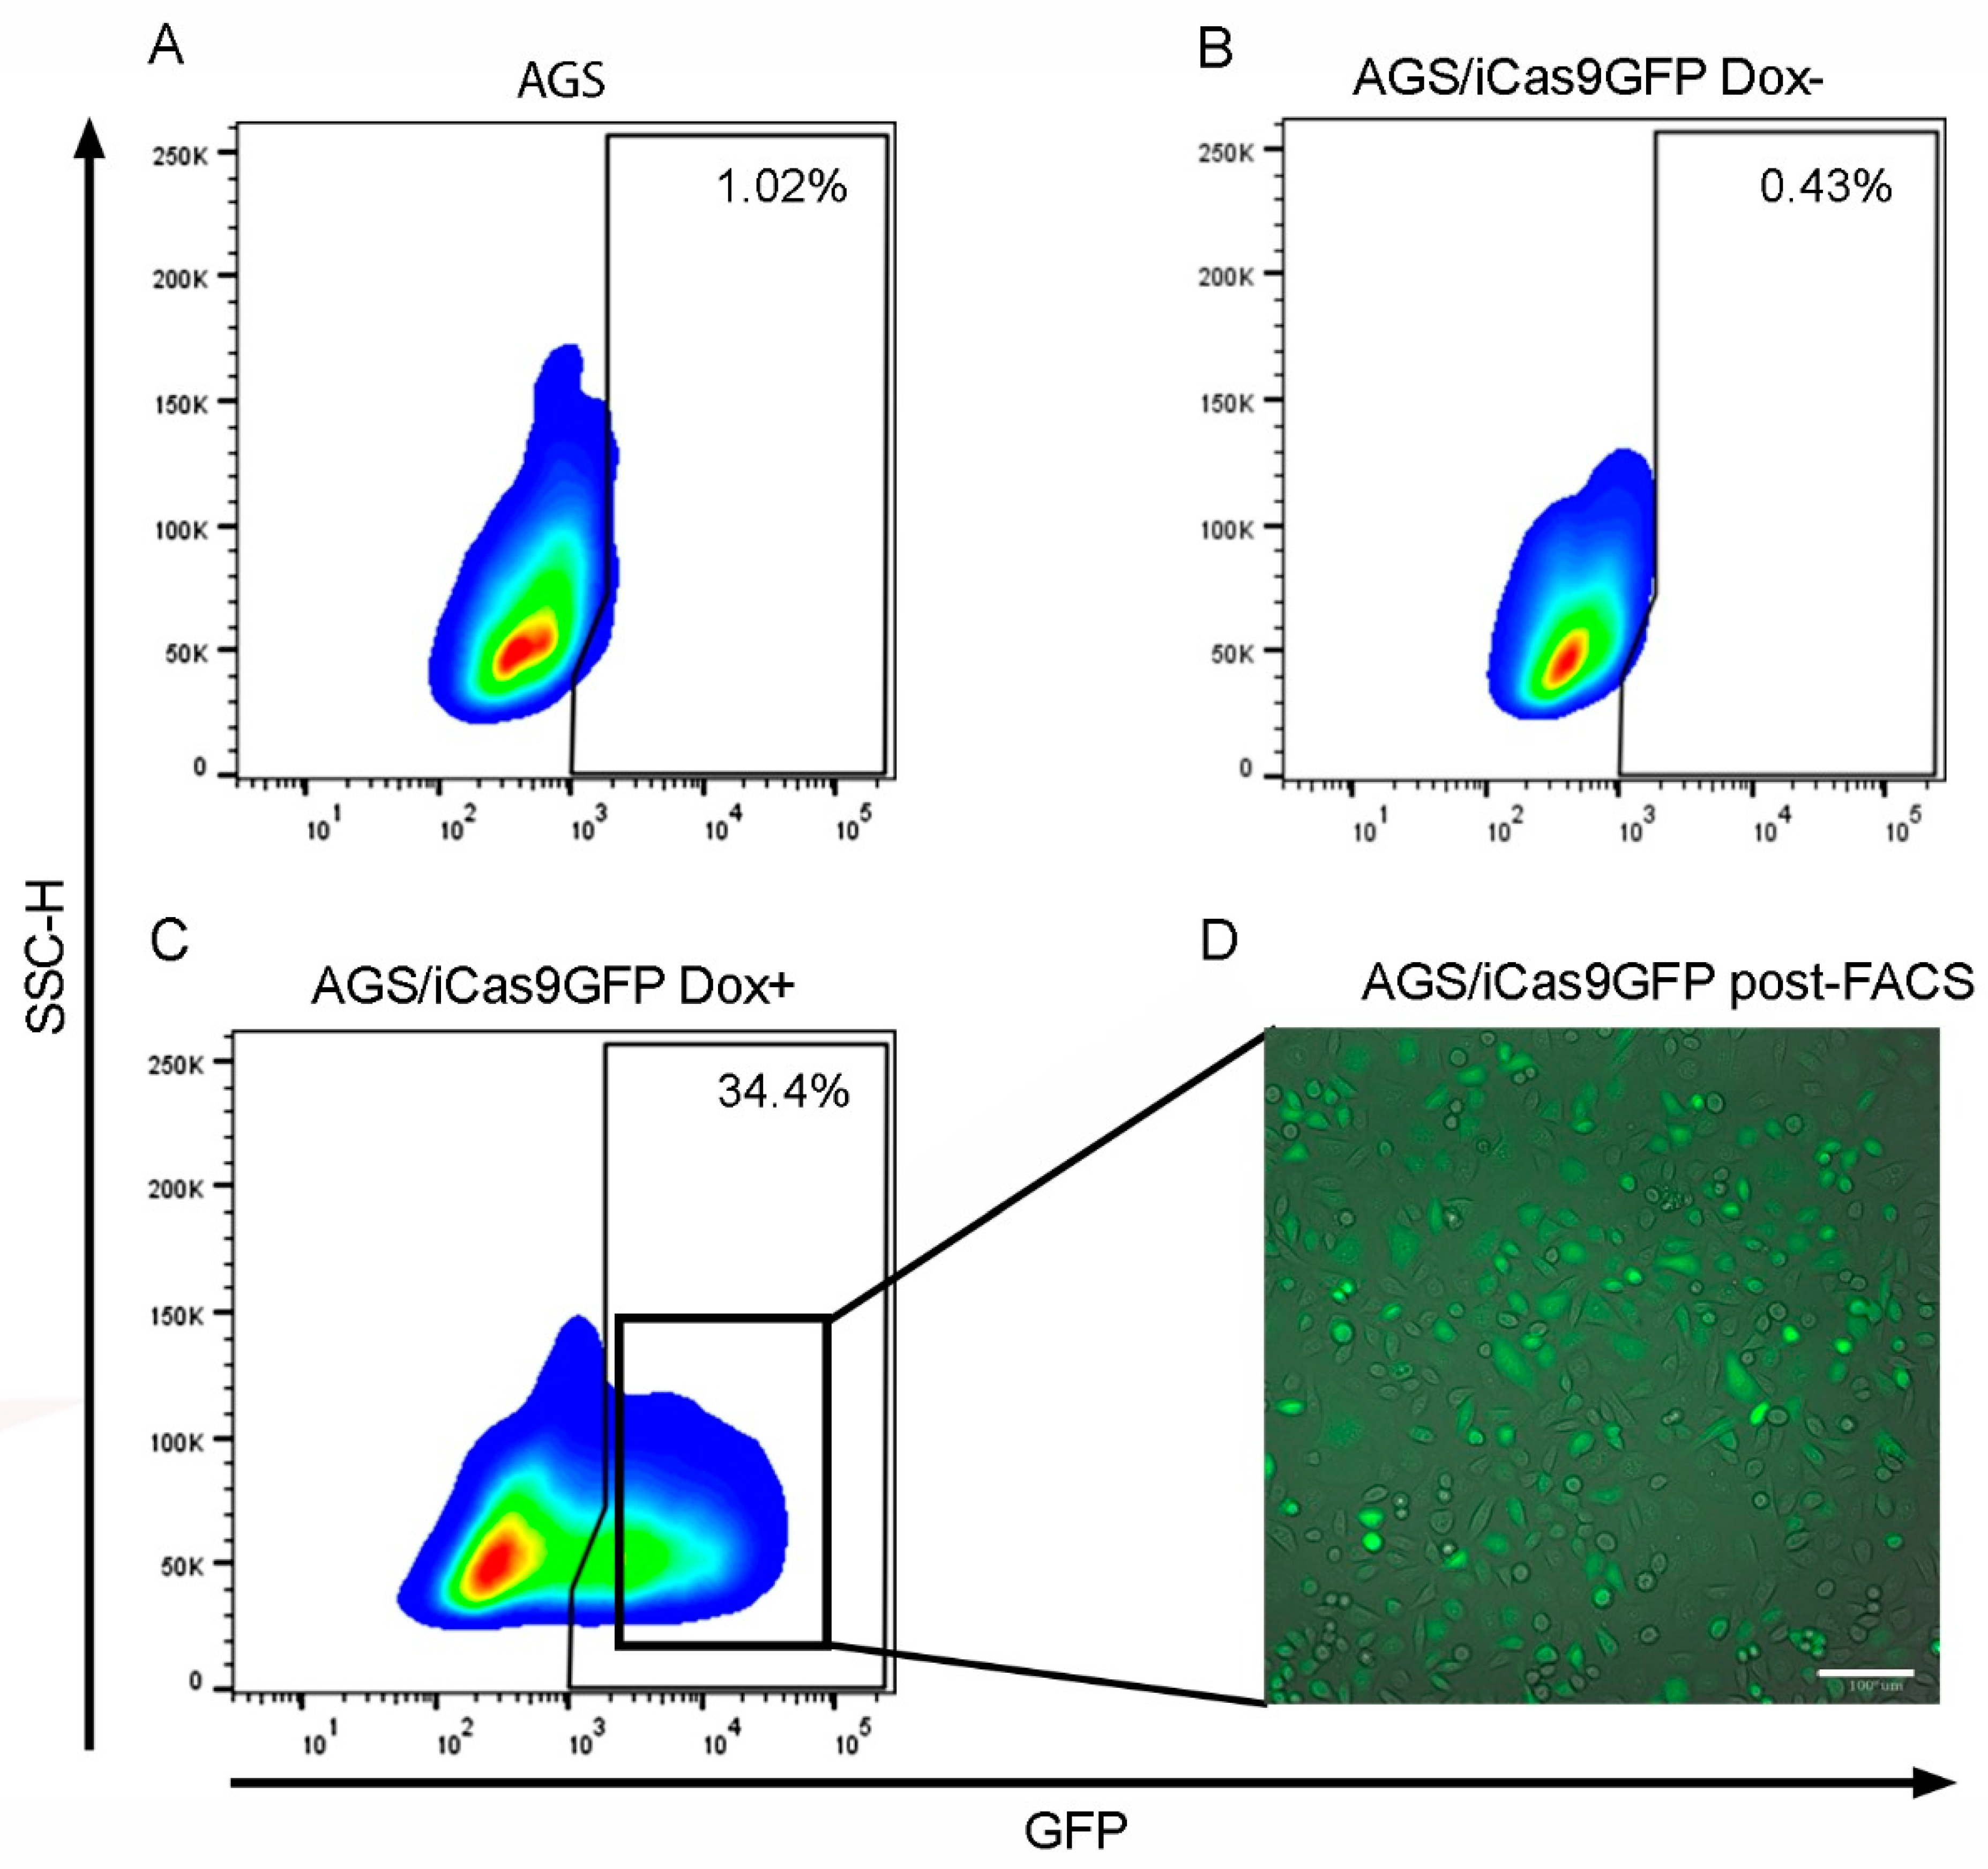
Fig. 1 The generation of an AGS/iCas9GFP cell line. (A) GFP basal expression in the AGS cell line. (B) GFP expression in the AGS/iCas9GFP cell line Dox−. (C) GFP expression in the AGS/iCas9GFP cell line after inducing with Dox+. (D) The fluorescence microscopy of the AGS/iCas9GFP cell lines after FACS, 20x. Dox+ and Dox−, with or without doxycycline, respectively. Bars indicate 100 µm.
Acknowledgments
This image is the copyrighted work of the attributed author or publisher, and
ZFIN has permission only to display this image to its users.
Additional permissions should be obtained from the applicable author or publisher of the image.
Full text @ Int. J. Mol. Sci.