
- Title
-
Mutational cooperativity of RUNX1::RUNX1T1 isoform 9a and oncogenic NRAS in zebrafish myeloid leukaemia
- Authors
- Lints, R., Walker, C.A., Delfi, O., Prouse, M., De Silva, M.P., Bohlander, S.K., Wood, A.C.
- Source
- Full text @ Biol. Open
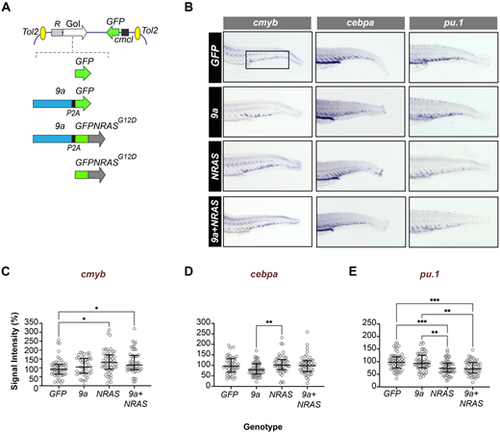
HSPC-targeted expression of human oncogenes perturbs myeloid fate regulators in early definitive haematopoiesis. (A) Schematic showing the structure of the Tol2 expression constructs used to generate F0 transgenic zebrafish. Top: generic organisation of the Tol2 destination vector showing the HSPC-specific R1+23 expression driver (R), the gene of interest (GoI) and the heart-specific cmcl2:GFP transgenesis marker. Bottom: Schematic showing GoI details. GFP (control), cDNAs encoding human RUNX1::RUNXT1 splice variant 9a (9a), human NRASG12D oncogene fused in frame to GFP (GFPNRASG12D). In 9a and 9a+NRAS constructs, the protein product of the second gene (GFP or GFPNRAS, respectively) is generated separately due to an intervening P2A “ribosome skipping” sequence (black box). (B) WISH of F0 mosaic animals at 72 hpf (hours post fertilisation) for cmyb (a definitive haematopoietic stem cell marker), pu.1 and cebpa (myeloid program regulators; see Table S2 for probe details). Shown is staining in the CHT region of the larval tail (fetal liver equivalent; boxed) with probe (top) and genotype (left) indicated. (C–E) Quantitative analysis of in situ probe signal intensity in the CHT (see Materials and Methods for details of the quantification process). Each circle corresponds to the normalized staining pixel intensity of a single animal for the probe indicated. The total number of animals shown per probe and genotype (∼50–60 animals) corresponds to two technical replicates. Statistical tests: Kruskal–Wallis (if non-Gaussian distribution) or ANOVA (if Gaussian distribution). cmyb probe: *, P=0.0114, 0.0399 (GFP versus NRAS; GFP versus 9a+NRAS, respectively); cepba probe: **P=0.0055 (9a versus NRAS); pu.1 probe: **, P<0.0031, 0.0013 (9a versus NRAS, 9a versus 9a+NRAS, respectively); ****, P<0.0007, 0.0003 (GFP versus NRAS, GFP versus 9a+NRAS, respectively). |
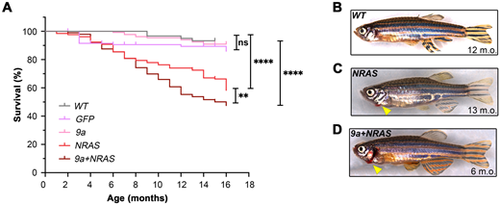
HSPC-targeted expression of human oncogenic 9a and NRAS, or NRAS alone, induces sickness and mortality in adult zebrafish. (A) Kaplan–Meier Survival Curve of F0 transgenic populations generated by injection of the expression constructs shown in Fig. 1A. Data shown corresponds to analyses of 2 to 4 injected batches per genotype. Numbers of animals per genotype, n: Wild type (WT), 60; GFP, 203; 9a, 132; NRAS, 131; 9a+NRAS, 384. Statistical test: Log-rank (Mantel-Cox) test: **P=0.009; ****P<0.0001; ns, not significant. (B–D) Whole animal images (stitched montages) of (B) healthy WT; (C) sick NRAS and (D) sick 9a+NRAS F0 animals. Bleeding from gills (arrowhead) is seen only in sick oncogenic transgenics. |
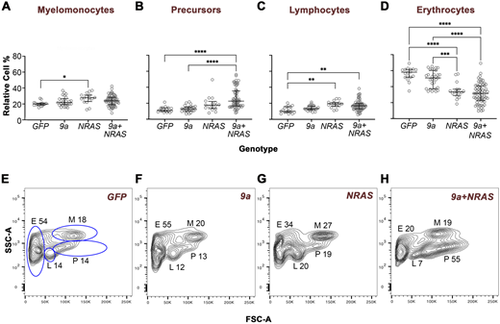
Oncogenic F0 transgenics exhibit distinct WKM cell flow cytometry profiles. Quantitative analyses of haematopoietic cell types in the zebrafish kidney marrow. WKM cells of the genotype indicated were subjected to forward versus side scatter (FSC/SSC) flow cytometry analysis, which resolves cells into four gated populations: myelomonocytes (M), progenitors/precursors (P), lymphocytes (L) and erythrocytes (E). For NRAS and 9a+NRAS genotypes, animals were sick (age of sickness: 7–16 months); for 9a or GFP animals were well and either age-matched with sick oncogenic animals or 16 months old. (A–D) Quantitative analyses of cell type percentages in the genotype indicated. For each animal, cell percentages were normalised so that the sum of all gates came to 100%. Each data point corresponds to a single animal. The total number of animals analysed per genotype, n: GFP, 17; 9a, 24; NRAS, 16; 9a+NRAS; 66. Statistical analysis: Ordinary one-way ANOVA, showing first (Q1), second (Q2, median) and third (Q3) quartiles. *, P=0.02/0.03; **, P=0.0015/0.0030; ***, P=0.0010; ****, P<0.0001. (E–H) Representative FSC/SSC flow cytometry profiles from individual animals of the genotype indicated. The fixed-gate dimensions (blue lines) shown in E were applied to all samples. The M, P, L and E numbers correspond to the relative percentage of cells in that gate. m.o., months old. See Fig. S7 for PCA of flow data. |
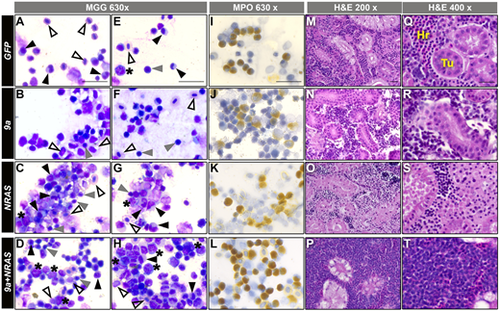
9a+NRAS F0 kidney marrow show blast cell expansion and hypercellularity. (A–H) WKM cell smears of the genotypes indicated (side banners), stained with May Grünwald Giemsa (MGG) stain, magnification (top banner). Number of animals assessed per genotype, n: GFP, 22; 9a, 31; NRAS, 11; 9a+NRAS, 34. Blast cells (*); myelomonocytes (black triangles); lymphocytes (grey triangles); erythrocytes (open triangles). Scale bar: 20 μM. (I–L) WKM cell smears of the genotype indicated stained for myeloperoxidase (MPO) enzyme activity, a marker of myeloid granulocytic fate. Scale bar: 20 μM. See Fig. S8 for statistical analysis of genotypes. (M–T) Haematoxylin and Eosin (H&E) staining of kidney marrow tissue sections from animals of the genotype indicated. Hr, haematopoietic cells; Tu, kidney tubules. All sectioned NRAS and 9a+NRAS animals were sick, while 9a and GFP animals were well. Number of animals assessed per genotype, n: GFP, 2; 9a, 5; NRAS, 4; 9a+NRAS, 12. Sections reveal overt hypercellularity in 1 of 6 9a+NRAS animals (P, T, Fig. S9Aviii). Scale bars: 20 μM. For both smears and sections, NRAS and 9a+NRAS animals shown were from sick, with age at time of sickness ranging from 7 to 16 months; GFP and 9a were healthy and were either age-matched or 16 months old. |
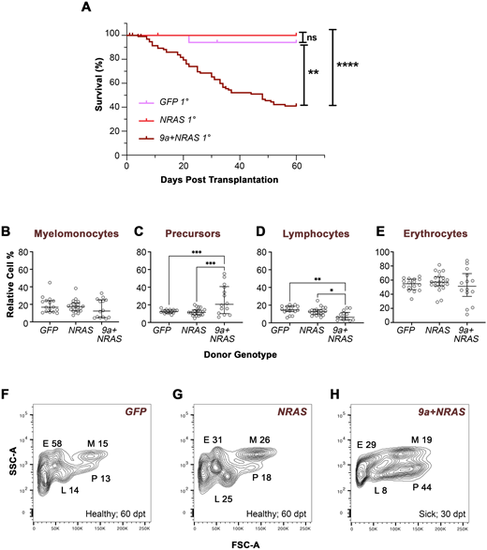
Transplanted 9a+NRAS-, but not NRAS disease, induces AML-like marrow cell profiles and sickness in recipient zebrafish. (A) Kaplan–Meier survival plot of primary (1°) recipients transplanted with WKM cells from F0 donors of the genotype indicated. Donor age at the time of sickness ranged from 9 to 13 months. The number of donors (d) and 1° recipients (r) per genotype was as follows: 9a+NRAS (d, 12; r, 72); NRAS (d, 5; r, 29); GFP (d, 4; r, 20). Statistical analysis: Log-Rank (Mantel-Cox) Test; **, P<0.0011; ****, P<0.0001; ns, not significant. (B–E) Quantitative analyses of WKM cells from primary recipient animals. Cells from recipients were subjected to FSC/SSC flow cytometry analysis, resolving cells into four gated populations. See Fig. 3 legend for details. Statistical analysis: Ordinary one-way ANOVA, showing first (Q1), second (Q2, median) and third (Q3) quartiles. *P=0.016; **P=0.004; ***P=0.0002/0.0006. (F–H) FSC/SSC flow cytometry plots from representative 1° recipients transplanted with cells the donor genotype indicated (see Fig. S10 for other examples). See Fig. S11 for RT-PCR confirmation of NRAS expression in recipient cells. dpt, days post-transplant. |