
|
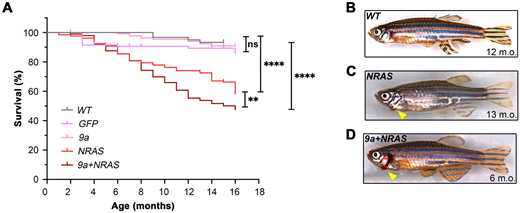
Fig. 2 HSPC-targeted expression of human oncogenic 9a and NRAS, or NRAS alone, induces sickness and mortality in adult zebrafish. (A) Kaplan–Meier Survival Curve of F0 transgenic populations generated by injection of the expression constructs shown in Fig. 1A. Data shown corresponds to analyses of 2 to 4 injected batches per genotype. Numbers of animals per genotype, n: Wild type (WT), 60; GFP, 203; 9a, 132; NRAS, 131; 9a+NRAS, 384. Statistical test: Log-rank (Mantel-Cox) test: **P=0.009; ****P<0.0001; ns, not significant. (B–D) Whole animal images (stitched montages) of (B) healthy WT; (C) sick NRAS and (D) sick 9a+NRAS F0 animals. Bleeding from gills (arrowhead) is seen only in sick oncogenic transgenics.