
|
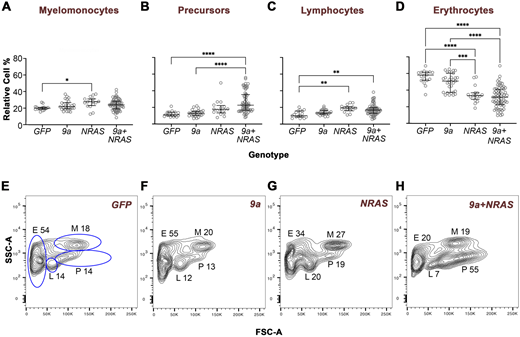
Fig. 3 Oncogenic F0 transgenics exhibit distinct WKM cell flow cytometry profiles. Quantitative analyses of haematopoietic cell types in the zebrafish kidney marrow. WKM cells of the genotype indicated were subjected to forward versus side scatter (FSC/SSC) flow cytometry analysis, which resolves cells into four gated populations: myelomonocytes (M), progenitors/precursors (P), lymphocytes (L) and erythrocytes (E). For NRAS and 9a+NRAS genotypes, animals were sick (age of sickness: 7–16 months); for 9a or GFP animals were well and either age-matched with sick oncogenic animals or 16 months old. (A–D) Quantitative analyses of cell type percentages in the genotype indicated. For each animal, cell percentages were normalised so that the sum of all gates came to 100%. Each data point corresponds to a single animal. The total number of animals analysed per genotype, n: GFP, 17; 9a, 24; NRAS, 16; 9a+NRAS; 66. Statistical analysis: Ordinary one-way ANOVA, showing first (Q1), second (Q2, median) and third (Q3) quartiles. *, P=0.02/0.03; **, P=0.0015/0.0030; ***, P=0.0010; ****, P<0.0001. (E–H) Representative FSC/SSC flow cytometry profiles from individual animals of the genotype indicated. The fixed-gate dimensions (blue lines) shown in E were applied to all samples. The M, P, L and E numbers correspond to the relative percentage of cells in that gate. m.o., months old. See Fig. S7 for PCA of flow data.