
Fig. 5
- ID
- ZDB-FIG-240903-114
- Publication
- Lints et al., 2024 - Mutational cooperativity of RUNX1::RUNX1T1 isoform 9a and oncogenic NRAS in zebrafish myeloid leukaemia
- Other Figures
- All Figure Page
- Back to All Figure Page
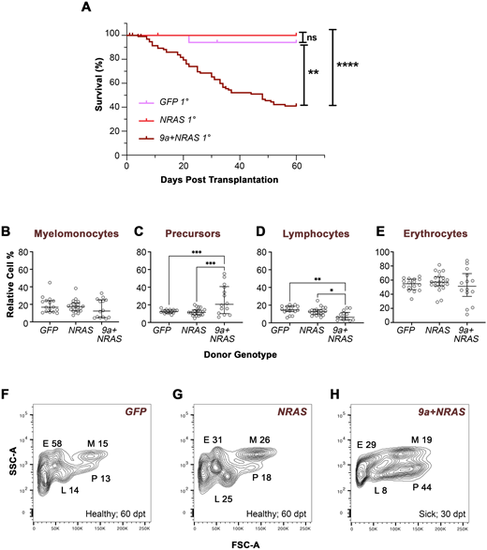
Transplanted 9a+NRAS-, but not NRAS disease, induces AML-like marrow cell profiles and sickness in recipient zebrafish. (A) Kaplan–Meier survival plot of primary (1°) recipients transplanted with WKM cells from F0 donors of the genotype indicated. Donor age at the time of sickness ranged from 9 to 13 months. The number of donors (d) and 1° recipients (r) per genotype was as follows: 9a+NRAS (d, 12; r, 72); NRAS (d, 5; r, 29); GFP (d, 4; r, 20). Statistical analysis: Log-Rank (Mantel-Cox) Test; **, P<0.0011; ****, P<0.0001; ns, not significant. (B–E) Quantitative analyses of WKM cells from primary recipient animals. Cells from recipients were subjected to FSC/SSC flow cytometry analysis, resolving cells into four gated populations. See Fig. 3 legend for details. Statistical analysis: Ordinary one-way ANOVA, showing first (Q1), second (Q2, median) and third (Q3) quartiles. *P=0.016; **P=0.004; ***P=0.0002/0.0006. (F–H) FSC/SSC flow cytometry plots from representative 1° recipients transplanted with cells the donor genotype indicated (see Fig. S10 for other examples). See Fig. S11 for RT-PCR confirmation of NRAS expression in recipient cells. dpt, days post-transplant. |