
Fig. 1
- ID
- ZDB-FIG-240903-110
- Publication
- Lints et al., 2024 - Mutational cooperativity of RUNX1::RUNX1T1 isoform 9a and oncogenic NRAS in zebrafish myeloid leukaemia
- Other Figures
- All Figure Page
- Back to All Figure Page
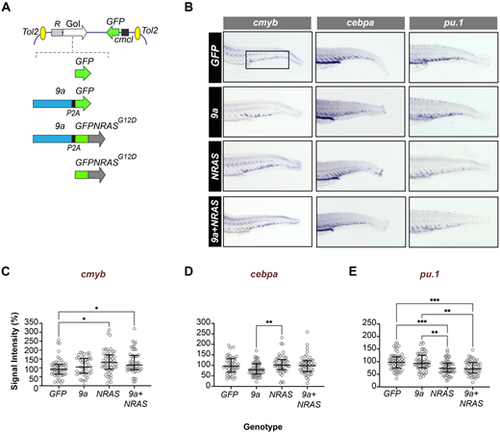
HSPC-targeted expression of human oncogenes perturbs myeloid fate regulators in early definitive haematopoiesis. (A) Schematic showing the structure of the Tol2 expression constructs used to generate F0 transgenic zebrafish. Top: generic organisation of the Tol2 destination vector showing the HSPC-specific R1+23 expression driver (R), the gene of interest (GoI) and the heart-specific cmcl2:GFP transgenesis marker. Bottom: Schematic showing GoI details. GFP (control), cDNAs encoding human RUNX1::RUNXT1 splice variant 9a (9a), human NRASG12D oncogene fused in frame to GFP (GFPNRASG12D). In 9a and 9a+NRAS constructs, the protein product of the second gene (GFP or GFPNRAS, respectively) is generated separately due to an intervening P2A “ribosome skipping” sequence (black box). (B) WISH of F0 mosaic animals at 72 hpf (hours post fertilisation) for cmyb (a definitive haematopoietic stem cell marker), pu.1 and cebpa (myeloid program regulators; see Table S2 for probe details). Shown is staining in the CHT region of the larval tail (fetal liver equivalent; boxed) with probe (top) and genotype (left) indicated. (C–E) Quantitative analysis of in situ probe signal intensity in the CHT (see Materials and Methods for details of the quantification process). Each circle corresponds to the normalized staining pixel intensity of a single animal for the probe indicated. The total number of animals shown per probe and genotype (∼50–60 animals) corresponds to two technical replicates. Statistical tests: Kruskal–Wallis (if non-Gaussian distribution) or ANOVA (if Gaussian distribution). cmyb probe: *, P=0.0114, 0.0399 (GFP versus NRAS; GFP versus 9a+NRAS, respectively); cepba probe: **P=0.0055 (9a versus NRAS); pu.1 probe: **, P<0.0031, 0.0013 (9a versus NRAS, 9a versus 9a+NRAS, respectively); ****, P<0.0007, 0.0003 (GFP versus NRAS, GFP versus 9a+NRAS, respectively). |