
Fig. 4
- ID
- ZDB-FIG-240903-113
- Publication
- Lints et al., 2024 - Mutational cooperativity of RUNX1::RUNX1T1 isoform 9a and oncogenic NRAS in zebrafish myeloid leukaemia
- Other Figures
- All Figure Page
- Back to All Figure Page
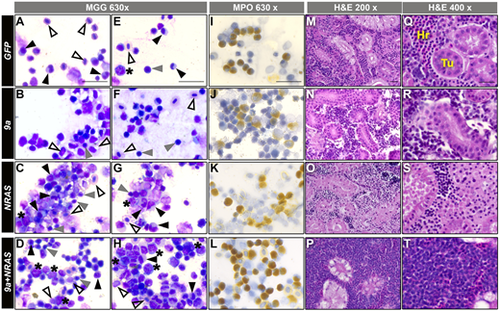
9a+NRAS F0 kidney marrow show blast cell expansion and hypercellularity. (A–H) WKM cell smears of the genotypes indicated (side banners), stained with May Grünwald Giemsa (MGG) stain, magnification (top banner). Number of animals assessed per genotype, n: GFP, 22; 9a, 31; NRAS, 11; 9a+NRAS, 34. Blast cells (*); myelomonocytes (black triangles); lymphocytes (grey triangles); erythrocytes (open triangles). Scale bar: 20 μM. (I–L) WKM cell smears of the genotype indicated stained for myeloperoxidase (MPO) enzyme activity, a marker of myeloid granulocytic fate. Scale bar: 20 μM. See Fig. S8 for statistical analysis of genotypes. (M–T) Haematoxylin and Eosin (H&E) staining of kidney marrow tissue sections from animals of the genotype indicated. Hr, haematopoietic cells; Tu, kidney tubules. All sectioned NRAS and 9a+NRAS animals were sick, while 9a and GFP animals were well. Number of animals assessed per genotype, n: GFP, 2; 9a, 5; NRAS, 4; 9a+NRAS, 12. Sections reveal overt hypercellularity in 1 of 6 9a+NRAS animals (P, T, Fig. S9Aviii). Scale bars: 20 μM. For both smears and sections, NRAS and 9a+NRAS animals shown were from sick, with age at time of sickness ranging from 7 to 16 months; GFP and 9a were healthy and were either age-matched or 16 months old. |