
- Title
-
A Novel Role for the Longevity-Associated Protein SLC39A11 as a Manganese Transporter
- Authors
- Xia, Z., Tang, B., Li, X., Li, X., Jia, Y., Jiang, J., Chen, J., Song, J., Liu, S., Min, J., Wang, F.
- Source
- Full text @ Research (Wash D C)
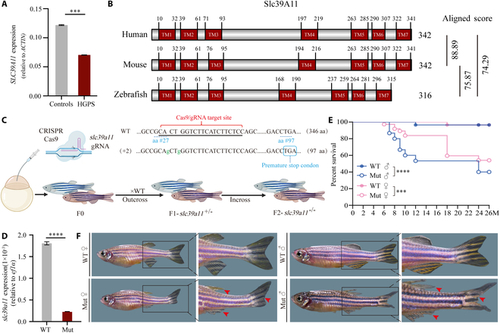
slc39a11 mutant zebrafish have an accelerated aging phenotype. (A) Summary of SLC39A11 mRNA measured in fibroblasts obtained from healthy controls and patients with Hutchinson–Gilford progeria syndrome (HGPS). (B) Alignment of the human, mouse, and zebrafish SLC39A11 proteins, with the 7 predicted transmembrane (TM) domains indicated; shown on the right are the homology scores obtained using ClustalW. (C) Strategy for generating slc39a11 mutant zebrafish. (D) Summary of slc39a11 mRNA measured in wild-type (WT) and slc39a11 mutant (Mut) zebrafish embryos. (E) Survival curves for male and female WT and Mut zebrafish (n ≥ 20 per group). (F) Representative images of adult (12-month-old) zebrafish. The red arrowheads indicate damaged fins. ***P < 0.001 and ****P < 0.0001. PHENOTYPE:
|
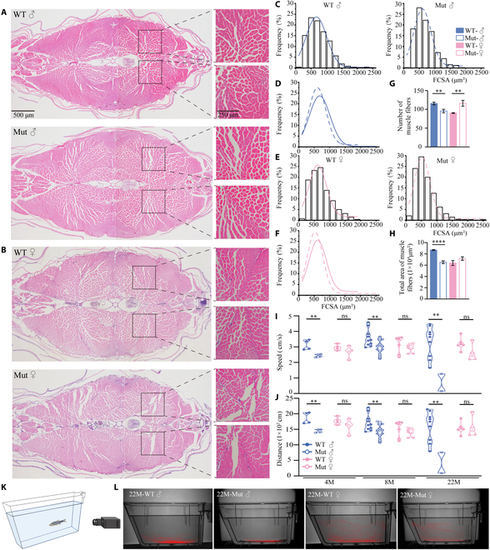
Skeletal muscle mass and locomotion are reduced in slc39a11 Mut zebrafish. (A and B) H&E-stained muscle fibers in the tails of male (A) and female (B) WT and Mut zebrafish. (C to F) Gaussian distribution analysis of the area of individual muscle fibers in male (C and D) and female (E and F) zebrafish. Note that the curves shown in (D) and (E) are reproduced from (C) and (E), respectively, for comparison purposes only. (G and H) Summary of the total number (G) and total cross-sectional area (H) of muscle fibers in adult male and female WT and Mut zebrafish. (I and J) Summary of swimming speed (I) and distance traveled (J) by male and female WT and Mut zebrafish at 4, 8, and 22 months of age. (K) Diagram depicting the process for recording zebrafish swimming behavior (see Materials and Methods for details). (L) Representative images of each animal’s cumulative position in the tank tracked for 8 min, measured for 22-month-old male and female WT and Mut zebrafish. **P < 0.01, ***P < 0.001, ****P < 0.0001; ns, not significant. |
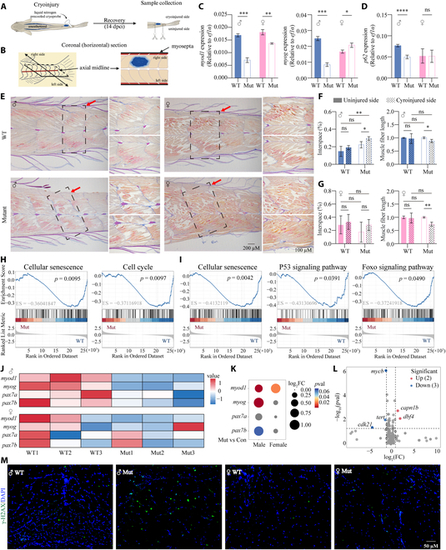
Impaired muscle regeneration and the potential aging mechanisms in the skeletal muscle of slc39a11 Mut zebrafish. (A) Schematic diagram depicting the protocol for inducing unilateral cryoinjury. The cryoprobe was precooled in liquid nitrogen and immediately placed on the right side of the anesthetized zebrafish for 6 s; 14 days after cryoinjury (14 dpci), samples were collected and analyzed. (B) Schematic diagram depicting a coronal section through the caudal peduncle of a cryoinjured sample. (C and D) Summary of myod1, myog, and p62 mRNA measured in the cryoinjured muscle tissue of male and female WT and Mut zebrafish. (E) Representative images showing the pattern of regenerated myomeres in male and female WT and Mut zebrafish. (F and G) Quantification of the gap (interspace) percentage (left panels) and relative length (right panels) of muscle fibers in the uninjured and cryoinjured sides in myomere samples obtained from male (F) and female (G) WT and Mut zebrafish. (H and I) Significant KEGG pathways related to the aging process in male (H) and female (I) groups that were enriched in Mut samples compared to WT samples, based on GSEA enrichment analysis. (J) Heatmap of the relative change in the expression of the indicated muscle regeneration-related marker genes in male and female WT and Mut samples. (K) Bubble chart analysis of the expression of the indicated muscle regeneration-related marker genes in male and female WT and Mut samples. (L) Volcano map of the expression of aging-related marker genes. (M) Fluorescence images of γ-H2AX immunostaining (green) in muscle fibers in male and female WT and Mut zebrafish; the nuclei were counterstained with 4′,6-diamidino-2-phenylindole (DAPI) (blue). *P < 0.05, **P < 0.01, ***P < 0.001, ****P < 0.0001. |
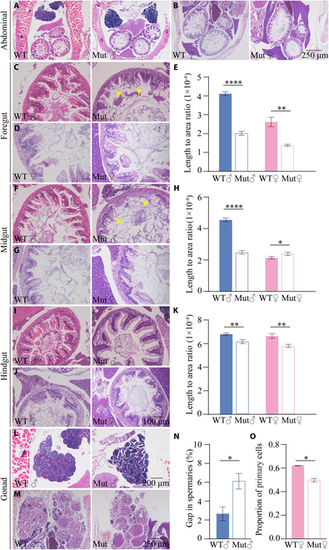
slc39a11 Mut zebrafish have altered visceral organ and gonad morphology. (A and B) H&E-stained abdominal sections prepared from male (A) and female (B) WT and Mut zebrafish. (C to E) H&E-stained foregut sections prepared from male (C) and female (D) WT and Mut zebrafish, and summary of the ratio between villus length and foregut area (E). (F to H) H&E-stained midgut sections prepared from male (F) and female (G) WT and Mut zebrafish, and summary of the ratio between villus length and midgut area (H). (I to K) H&E-stained foregut sections prepared from male (I) and female (J) WT and Mut zebrafish, and summary of the ratio between villus length and foregut area (K). (L and M) H&E-stained spermary (L) and ovary (M) sections prepared from male (L) and female (M) WT and Mut zebrafish. (N and O) Summary of the percentage of gaps in the spermaries of male WT and Mut zebrafish (N), and summary of the percentage of primary oocytes in the ovaries of female WT and Mut zebrafish (O). *P < 0.05, **P < 0.01, and ****P < 0.0001. PHENOTYPE:
|
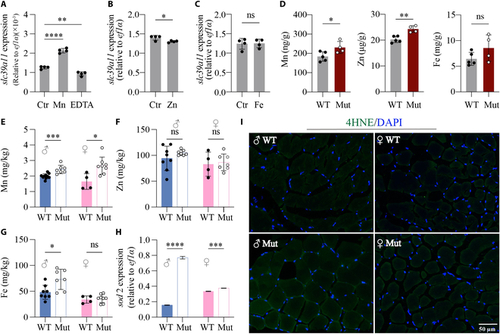
Mn exposure increases slc39a11 expression in zebrafish, and slc39a11 Mut zebrafish have increased Mn content. (A to C) Summary of slc39a11 mRNA measured in untreated (Ctr) WT zebrafish embryos and embryos treated with either 100 μM MnCl2 or the chelator EDTA (A), 100 μM ZnSO4 (B), or 100 μM ferric citrate (C). (D) Summary of Mn, Zn, and Fe content measured in WT and slc39a11 Mut zebrafish embryos. (E to G) Summary of Mn (E), Zn (F), and Fe (G) content measured in male and female WT and Mut zebrafish adults. (H) Summary of sod2 mRNA measured in the muscle tissue of male and female WT and Mut zebrafish. (I) Fluorescence images of 4-HNE immunostaining (green) in muscle fibers of male and female WT and Mut zebrafish; the nuclei were counterstained with DAPI (blue). *P < 0.05, **P < 0.01, ***P < 0.001, ****P < 0.0001. |
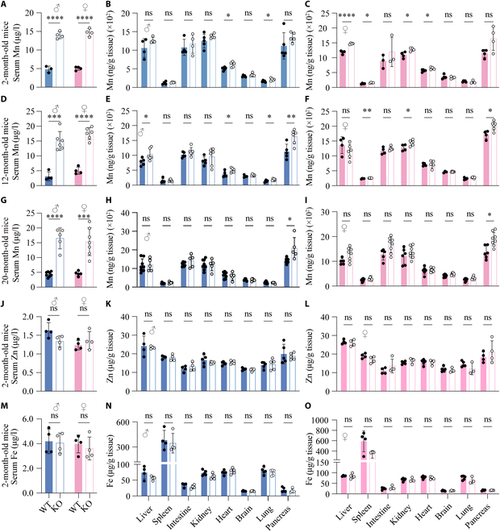
Serum Mn levels are elevated in global Slc39a11 knockout mice. (A to I) Mn levels in the serum and the indicated tissues were measured in 2-month-old (A to C), 12-month-old (D to F), and 20-month-old (G to I) male and female WT and Slc39a11 knockout (KO) mice. (J to O) Summary of Zn (J to L) and Fe (M to O) content measured in the serum and indicated tissues of 2-month-old male and female WT and KO. *P < 0.05, **P < 0.01, ***P < 0.001, ****P < 0.0001. |
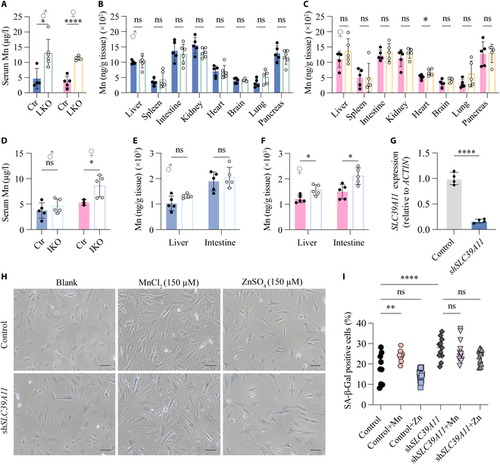
Tissue-specific Slc39a11 knockout mice have increased serum Mn levels, and knocking down SLC39A11 in vitro increases cellular senescence. (A to C) Summary of Mn levels measured in the serum (A) and indicated tissues (B and C) in 2-month-old Slc39a11flox/flox (Ctr) and liver-specific Slc39a11 knockout (LKO) male (B) and female (C) mice. (D to F) Summary of Mn levels measured in the serum (D) and liver and intestine (E and F) of 2-month-old Slc39a11flox/flox (Ctr) and intestine-specific Slc39a11 knockout (IKO) male (E) and female (F) mice. (G) Summary of SLC39A11 mRNA measured in control fibroblasts and fibroblasts expressing an shRNA against SLC39A11 (shSLC39A11). (H) Representative phase contrast images of control fibroblasts and fibroblasts expressing shSLC39A11 stained for SA-β-Gal after exposure to no additional metal ions (blank), 150 μm MnCl2, or 150 μM ZnSO4. Scar bar, 10 µm. (I) Summary of the percentage of SA-β-Gal-positive cells treated as indicated. *P < 0.05, **P < 0.01, ****P < 0.0001. |