
- Title
-
Transient titin-dependent ventricular defects during development lead to adult atrial arrhythmia and impaired contractility
- Authors
- Jiang, X., Ly, O.T., Chen, H., Zhang, Z., Ibarra, B.A., Pavel, M.A., Brown, G.E., Sridhar, A., Tofovic, D., Swick, A., Marszalek, R., Vanoye, C.G., Navales, F., George, A.L., Khetani, S.R., Rehman, J., Gao, Y., Darbar, D., Saxena, A.
- Source
- Full text @ iScience
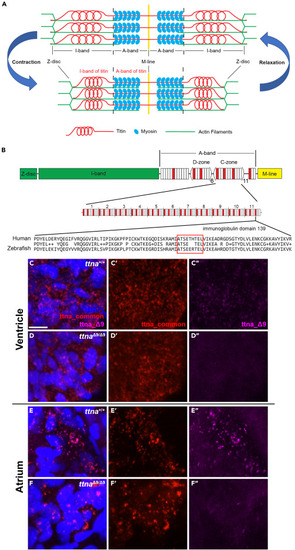
ttnaΔ9 results in a 9 amino acid deletion in an immunoglobin-like domain corresponding to the human Ig-139 domain of titin A-band (A) Schematic of major components of the sarcomere. (B) Schematic of the full-length human titin protein and detailed layout of the C-zone in the A-band. Red, Ig domain. White, fibronectin type-III (FN3) domain. There are 11 repeats of Ig-FN3-FN3-Ig-FN3-FN3-FN3-Ig-FN3-FN3-FN3 pattern of domains in the C-zone. Amino acid sequence alignment between human Ig domain 139 (Ig-139) and its corresponding Ig domain (Ig-107) in the zebrafish ttna protein. Red box indicates the location of residues deleted in the TTN Δ9 and ttnaΔ9 mutation. (C–F″) Representative 3D projection images of in situ hybridization chain reaction with probes targeting ttna mRNA in either the 27 base pair deleted region (ttna_Δ9, magenta) or regions approximately 1,500 base pairs upstream and downstream of the deletion (ttna_common, red) in ventricular (C–D″) and atrial (E–F″) cardiomyocytes of wild-type (ttna+/+, n = 6) and ttnaΔ9/Δ9 (n = 6) zebrafish embryos at 48 h postfertilization (hpf). Optical section thickness: 29.8 μm. Scale bar: 10 μm. See also Figure S1 . |
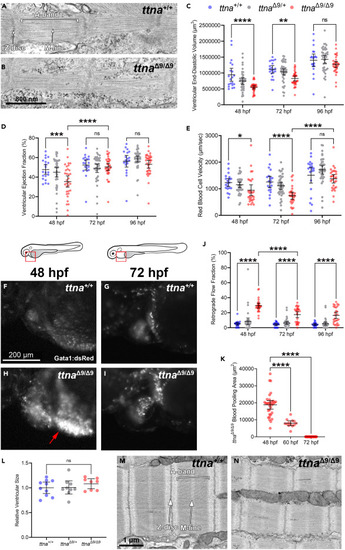
ttnaΔ9/Δ9 zebrafish exhibit a transient reduction in ventricular function during development (A and B) Representative transmission electron microscopy (TEM) images of sarcomeres in wild-type (ttna+/+, n = 2) and ttnaΔ9/Δ9 (n = 5) zebrafish embryonic cardiomyocytes at 48 hpf. (C–E) Quantification of ventricular end-diastolic volume (C), ejection fraction (D), and red blood cell velocity (E) for ttna+/+, ttnaΔ9/+, and ttnaΔ9/Δ9 embryos at 48, 72, and 96 hpf. (F–I) Representative images of wild-type and ttnaΔ9/Δ9 embryos’ blood flow in the inflow tract, visualized with the red blood cell-labeling transgenic line gata1:dsRed at 48 and 72 hpf. Red boxes indicate the location of the inflow tract, and red arrow indicates blood pooling. (J) Quantification of the blood retrograde flow fraction between the atrium and inflow tract for ttna+/+, ttnaΔ9/+, and ttnaΔ9/Δ9 embryos at 48, 72, and 96 hpf. (K) Quantification of blood-pooling area in the inflow tract of ttnaΔ9/Δ9 embryos at 48, 60, and 72 hpf. (L) 12–15-months-old ttna+/+ (n = 10), ttnaΔ9/+ (n = 9), and ttnaΔ9/Δ9 (n = 8) ventricular relative size. (M and N) Representative TEM images of sarcomeres in ttna+/+ (n = 3) and ttnaΔ9/Δ9 (n = 3) ventricular cardiomyocytes at 6 months of age. n value for (C–K): ttna+/+ n = 20, ttnaΔ9/+ n = 39, ttnaΔ9/Δ9 n = 33. Data in (C–E, J–L) are represented as mean ±95% confidence intervals. ns p > 0.05; ∗p < 0.05; ∗∗p < 0.01; ∗∗∗p < 0.001; ∗∗∗∗p < 0.0001. See also Figures S2 and S4 . |
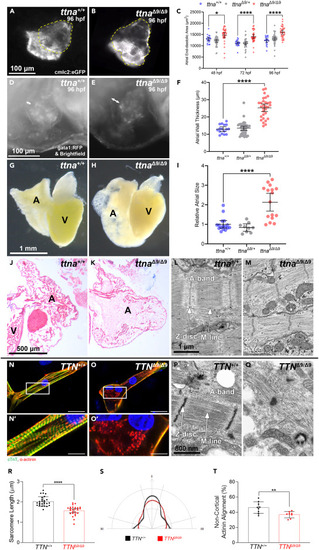
ttnaΔ9/Δ9 zebrafish exhibit persistent atrial enlargement, and sarcomeric disorganization is found in ttnaΔ9/Δ9 zebrafish atrial cardiomyocytes and TTNΔ9/Δ9-hiPSC-aCMs (A and B) Representative images of 96 hpf ttna+/+ and ttnaΔ9/Δ9 zebrafish hearts visualized with the cardiomyocyte-labeling transgenic line cmlc2:eGFP. Yellow dashed lines outline the atria. (C) Quantification of atrial end-diastolic area for ttna+/+ (n = 20), ttnaΔ9/+ (n = 39), and ttnaΔ9/Δ9 (n = 33) embryos at 48, 72, and 96 hpf. (D–F) Representative images of 96 hpf ttna+/+ and ttnaΔ9/Δ9 hearts and blood visualized with bright field and the red blood cell-labeling transgenic line gata1:dsRed, respectively. White arrows indicate the atrial myocardial wall. (F) Quantification of atrial myocardial wall thickness at 96 hpf. n value: ttna+/+ = 16, ttnaΔ9/+ = 37, ttnaΔ9/Δ9 = 32. (G and H) Representative bright-field images of dissected hearts from 8–15-months-old ttna+/+ and ttnaΔ9/Δ9 zebrafish. A, atrium. V, ventricle. (I) Relative atrial size of ttna+/+ (n = 16), ttnaΔ9/Δ9 (n = 9), and ttnaΔ9/Δ9 (n = 16) zebrafish. (J and K) Representative images of atria trichrome staining from 12-months-old ttna+/+ (n = 4) and ttnaΔ9/Δ9 (n = 3) zebrafish. A, atrium. V, ventricle. (L and M) Representative TEM images of sarcomeres in ttna+/+ (n = 3) and ttnaΔ9/Δ9 (n = 3) zebrafish atrial cardiomyocytes at 6 months of age. (N–O′) Representative images of immunofluorescence staining targeting cardiac troponin T (cTnT; green) and α-actinin (red) in TTN+/+-hiPSC-aCMs (N) and TTNΔ9/Δ9-hiPSC-aCMs (O) with insets (N′, O′). Scale bar: (N, O) 30 μm; (N′, O′) 15 μm. (P and Q) Representative TEM images of TTN+/+-hiPSC-aCMs and TTNΔ9/Δ9-hiPSC-aCMs. (R–T) Quantification of sarcomeric length in TTN+/+-hiPSC-aCMs and TTNΔ9/Δ9-hiPSC-aCMs (n = 3 independent batches, n = 8–9 cells per batch). (S–T) Measurement of non-cortical actinin alignment against perpendicular and parallel axes of TTN+/+-hiPSC-aCMs and TTNΔ9/Δ9-hiPSC-aCMs (n = 3 independent batches, n = 2–3 cells per batch). Data in (C, F, I, R, and T) are represented as mean ±95% confidence intervals. ∗p < 0.05; ∗∗p < 0.01; ∗∗∗∗p < 0.0001. See also Figures S3–S6 . |
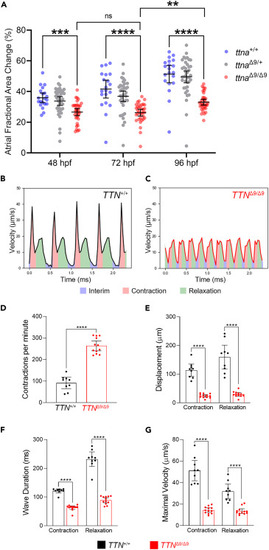
ttnaΔ9/Δ9 zebrafish atria and TTNΔ9/Δ9-hiPSC-aCMs exhibit reduced atrial contractility (A) Quantification of atrial contraction for ttna+/+ (n = 20), ttnaΔ9/+ (n = 39), and ttnaΔ9/Δ9 (n = 33) embryos at 48, 72, and 96 hpf. (B and C) Representative recordings of the contraction of TTN+/+-hiPSC-aCMs and TTNΔ9/Δ9-hiPSC-aCMs. (D–G) Quantification of contraction frequency (D), displacement (E), wave component duration (F), and maximal velocity (G) during contraction and relaxation of hiPSC-aCMs (n = 3 independent batches, n = 3 biological replicates per batch). Data in (A, D–G) are represented as mean ±95% confidence intervals. ns p > 0.05; ∗∗p < 0.01; ∗∗∗p < 0.001; ∗∗∗∗p < 0.0001. See also Figure S7 and Table S1 . |
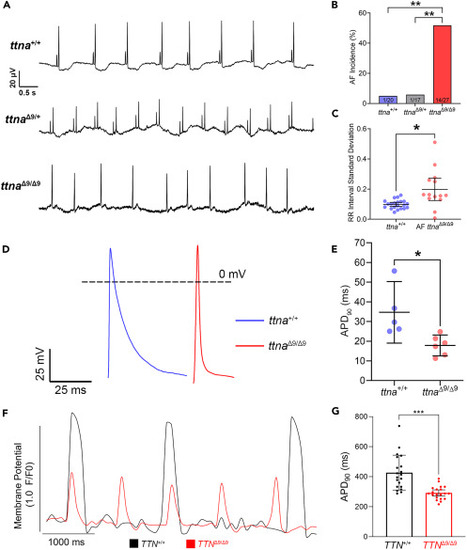
ttnaΔ9/Δ9 adult zebrafish exhibit atrial fibrillation (AF), and both ttnaΔ9/Δ9 zebrafish atrial cardiomyocytes and TTNΔ9/Δ9-hiPSC-aCMs demonstrate abnormal electrophysiology (A) Representative electrocardiogram (ECG) recordings of 7–15-months-old ttna+/+ (n = 20), ttnaΔ9/Δ9 (n = 17), and ttnaΔ9/Δ9 (n = 27) zebrafish hearts. Upper panel: ttna+/+ ECG trace; middle panel: ttnaΔ9/+ ECG trace; lower panel: ttnaΔ9/Δ9 ECG trace demonstrating P-wave loss and arrhythmia. (B) Quantification of AF incidence in ttna+/+, ttnaΔ9/+, and ttnaΔ9/Δ9 adult zebrafish. (C) Quantification of heartbeat interval standard deviation in zebrafish with AF in comparison to ttna+/+ adults. (D) Representative recordings of action potential (AP) on isolated ttna+/+ (n = 5) and ttnaΔ9/Δ9 (n = 6) zebrafish atrial cardiomyocytes at 12 months of age. (E) Quantification of AP duration at 90% repolarization (APD90) in isolated zebrafish atrial cardiomyocytes. (F) Representative optical AP recordings of TTN+/+-hiPSC-aCMs and TTNΔ9/Δ9-hiPSC-aCMs with voltage-sensitive dye VF2.1Cl. (G) Quantification of APD90 in hiPSC-aCMs (n = 4 independent batches, n = 5–6 biological replicates per batch). Data in (C, E, and G) are represented as mean ±95% confidence intervals. ∗p < 0.05; ∗∗p < 0.01; ∗∗∗p < 0.001. See also Figure S8 . |
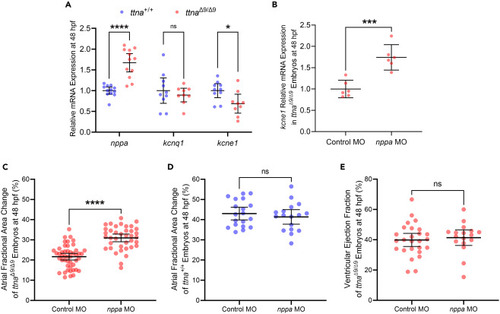
ttnaΔ9/Δ9 zebrafish embryos exhibit ANP upregulation and ANP-dependent changes in IKs channel components and atrial function (A) Quantification of mRNA levels for nppa, kcnq1, and kcne1 in zebrafish embryos at 48 hpf. Each dot represents a biological replicate, and each replicate contains 5–10 embryos. (B) Quantification of mRNA levels for kcne1 in negative control morpholino (Control MO)-treated or morpholino targeting nppa (nppa MO)-treated ttnaΔ9/Δ9 zebrafish embryos at 48 hpf. Each data point represents a biological replicate, and each replicate contains 5–10 embryos. (C) Quantification for atrial contraction of Control MO-treated (n = 47) or nppa MO-treated (n = 38) ttnaΔ9/Δ9 zebrafish embryos at 48 hpf. (D) Quantification for atrial contraction of Control MO-treated (n = 19) or nppa MO-treated (n = 17) ttna+/+ zebrafish embryos at 48 hpf. (E) Quantification of ventricular contraction of Control MO-treated (n = 26) or nppa MO-treated (n = 17) ttnaΔ9/Δ9 zebrafish embryos at 48 hpf. Data are represented as mean ±95% confidence intervals. ns p > 0.05; ∗p < 0.05; ∗∗∗p < 0.001; ∗∗∗∗p < 0.0001. See also Figures S9 and S10 . |
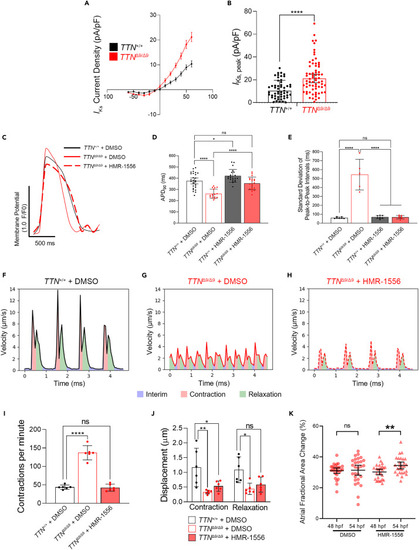
Targeted pharmacological blockade of IKs rescues the arrhythmia and improves contraction and relaxation in TTNΔ9/Δ9-hiPSC-aCMs and ttnaΔ9/Δ9 zebrafish atria (A and B) High-throughput voltage clamping showing IKs in TTNΔ9/Δ9-hiPSC-aCMs (n = 71) compared to TTN+/+-hiPSC-aCMs (n = 59): current-voltage (I-V) curves (A) and quantification of IKs densities at +60 mV (B). (C) Representative optical action potential recordings of TTN+/+-hiPSC-aCMs and TTNΔ9/Δ9-hiPSC-aCMs treated with either vehicle (DMSO) or HMR-1556 in DMSO. (D and E) Quantification of APD90 (D) and contraction rhythm (E) of DMSO- or HMR-1556/DMSO-treated TTN+/+-hiPSC-aCMs and TTNΔ9/Δ9-hiPSC-aCMs. (n = 3 independent batches, n = 5–9 biological replicates per batch). (F–H) Representative recordings of contractility analysis on hiPSC-aCMs treated with DMSO or HMR-1556/DMSO. (I and J) Quantification of contractility parameters including contraction frequency (I, 1-way ANOVA with Bonferroni’s correction) and displacement (J, two-way ANOVA with Bonferroni’s correction, n = 3 independent batches, n = 2 biological replicates per batch). (K) Quantification of ttnaΔ9/Δ9 zebrafish embryo atrial contraction under either DMSO (n = 28) or 10 μM HMR-1556/DMSO (n = 27) treatment from 50 to 54 hpf. Data in (A, B, D–E, and I–K) are represented as mean ±95% confidence intervals. ns p > 0.05; ∗p < 0.05; ∗∗p < 0.01; ∗∗∗∗p < 0.0001. See also Figures S11–S13 . |