
|
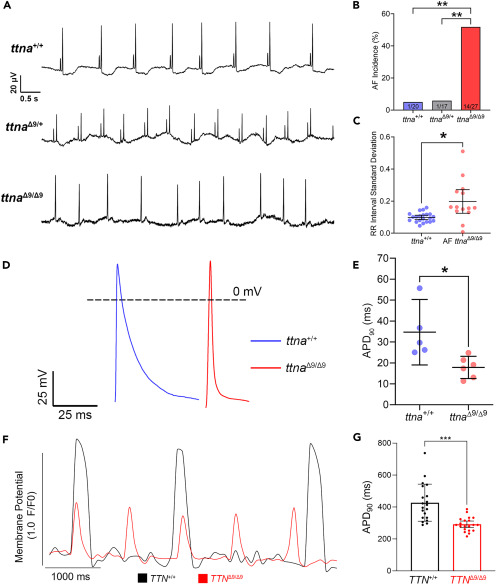
Fig. 5 ttnaΔ9/Δ9 adult zebrafish exhibit atrial fibrillation (AF), and both ttnaΔ9/Δ9 zebrafish atrial cardiomyocytes and TTNΔ9/Δ9-hiPSC-aCMs demonstrate abnormal electrophysiology (A) Representative electrocardiogram (ECG) recordings of 7–15-months-old ttna+/+ (n = 20), ttnaΔ9/Δ9 (n = 17), and ttnaΔ9/Δ9 (n = 27) zebrafish hearts. Upper panel: ttna+/+ ECG trace; middle panel: ttnaΔ9/+ ECG trace; lower panel: ttnaΔ9/Δ9 ECG trace demonstrating P-wave loss and arrhythmia. (B) Quantification of AF incidence in ttna+/+, ttnaΔ9/+, and ttnaΔ9/Δ9 adult zebrafish. (C) Quantification of heartbeat interval standard deviation in zebrafish with AF in comparison to ttna+/+ adults. (D) Representative recordings of action potential (AP) on isolated ttna+/+ (n = 5) and ttnaΔ9/Δ9 (n = 6) zebrafish atrial cardiomyocytes at 12 months of age. (E) Quantification of AP duration at 90% repolarization (APD90) in isolated zebrafish atrial cardiomyocytes. (F) Representative optical AP recordings of TTN+/+-hiPSC-aCMs and TTNΔ9/Δ9-hiPSC-aCMs with voltage-sensitive dye VF2.1Cl. (G) Quantification of APD90 in hiPSC-aCMs (n = 4 independent batches, n = 5–6 biological replicates per batch). Data in (C, E, and G) are represented as mean ±95% confidence intervals. ∗p < 0.05; ∗∗p < 0.01; ∗∗∗p < 0.001. See also Figure S8 .