
|
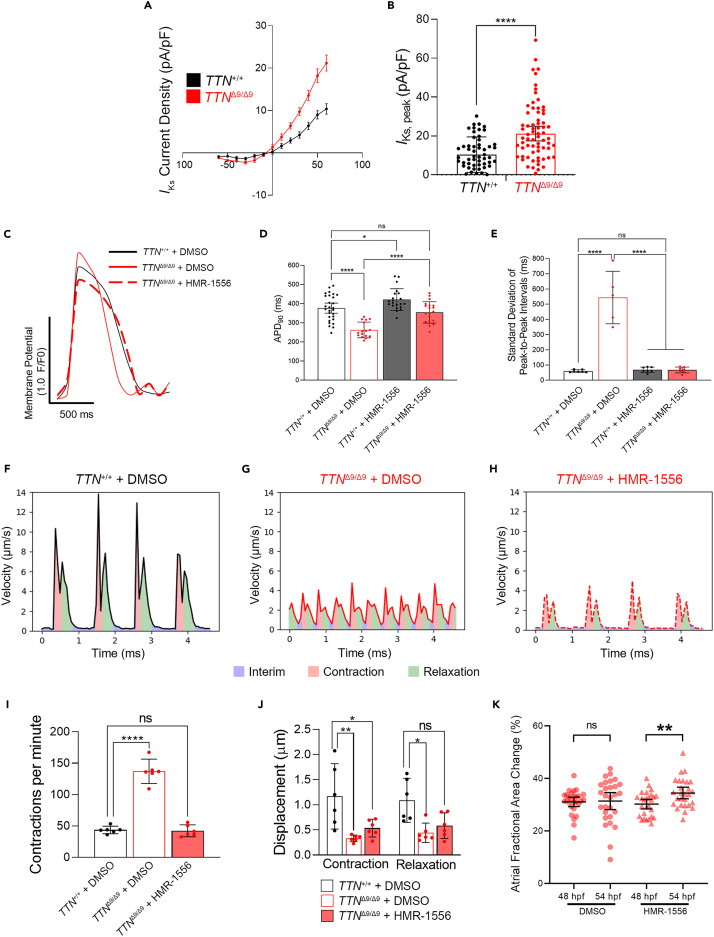
Fig. 7 Targeted pharmacological blockade of IKs rescues the arrhythmia and improves contraction and relaxation in TTNΔ9/Δ9-hiPSC-aCMs and ttnaΔ9/Δ9 zebrafish atria (A and B) High-throughput voltage clamping showing IKs in TTNΔ9/Δ9-hiPSC-aCMs (n = 71) compared to TTN+/+-hiPSC-aCMs (n = 59): current-voltage (I-V) curves (A) and quantification of IKs densities at +60 mV (B). (C) Representative optical action potential recordings of TTN+/+-hiPSC-aCMs and TTNΔ9/Δ9-hiPSC-aCMs treated with either vehicle (DMSO) or HMR-1556 in DMSO. (D and E) Quantification of APD90 (D) and contraction rhythm (E) of DMSO- or HMR-1556/DMSO-treated TTN+/+-hiPSC-aCMs and TTNΔ9/Δ9-hiPSC-aCMs. (n = 3 independent batches, n = 5–9 biological replicates per batch). (F–H) Representative recordings of contractility analysis on hiPSC-aCMs treated with DMSO or HMR-1556/DMSO. (I and J) Quantification of contractility parameters including contraction frequency (I, 1-way ANOVA with Bonferroni’s correction) and displacement (J, two-way ANOVA with Bonferroni’s correction, n = 3 independent batches, n = 2 biological replicates per batch). (K) Quantification of ttnaΔ9/Δ9 zebrafish embryo atrial contraction under either DMSO (n = 28) or 10 μM HMR-1556/DMSO (n = 27) treatment from 50 to 54 hpf. Data in (A, B, D–E, and I–K) are represented as mean ±95% confidence intervals. ns p > 0.05; ∗p < 0.05; ∗∗p < 0.01; ∗∗∗∗p < 0.0001. See also Figures S11–S13 .