
Fig. 3
- ID
- ZDB-FIG-240806-44
- Publication
- Jiang et al., 2024 - Transient titin-dependent ventricular defects during development lead to adult atrial arrhythmia and impaired contractility
- Other Figures
- All Figure Page
- Back to All Figure Page
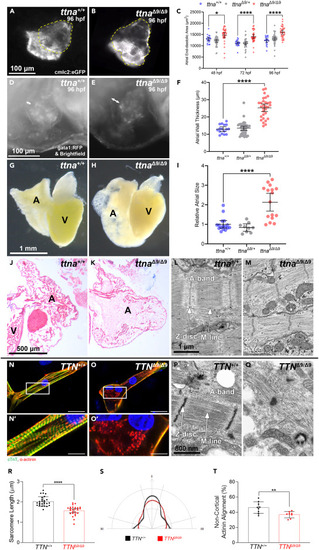
ttnaΔ9/Δ9 zebrafish exhibit persistent atrial enlargement, and sarcomeric disorganization is found in ttnaΔ9/Δ9 zebrafish atrial cardiomyocytes and TTNΔ9/Δ9-hiPSC-aCMs (A and B) Representative images of 96 hpf ttna+/+ and ttnaΔ9/Δ9 zebrafish hearts visualized with the cardiomyocyte-labeling transgenic line cmlc2:eGFP. Yellow dashed lines outline the atria. (C) Quantification of atrial end-diastolic area for ttna+/+ (n = 20), ttnaΔ9/+ (n = 39), and ttnaΔ9/Δ9 (n = 33) embryos at 48, 72, and 96 hpf. (D–F) Representative images of 96 hpf ttna+/+ and ttnaΔ9/Δ9 hearts and blood visualized with bright field and the red blood cell-labeling transgenic line gata1:dsRed, respectively. White arrows indicate the atrial myocardial wall. (F) Quantification of atrial myocardial wall thickness at 96 hpf. n value: ttna+/+ = 16, ttnaΔ9/+ = 37, ttnaΔ9/Δ9 = 32. (G and H) Representative bright-field images of dissected hearts from 8–15-months-old ttna+/+ and ttnaΔ9/Δ9 zebrafish. A, atrium. V, ventricle. (I) Relative atrial size of ttna+/+ (n = 16), ttnaΔ9/Δ9 (n = 9), and ttnaΔ9/Δ9 (n = 16) zebrafish. (J and K) Representative images of atria trichrome staining from 12-months-old ttna+/+ (n = 4) and ttnaΔ9/Δ9 (n = 3) zebrafish. A, atrium. V, ventricle. (L and M) Representative TEM images of sarcomeres in ttna+/+ (n = 3) and ttnaΔ9/Δ9 (n = 3) zebrafish atrial cardiomyocytes at 6 months of age. (N–O′) Representative images of immunofluorescence staining targeting cardiac troponin T (cTnT; green) and α-actinin (red) in TTN+/+-hiPSC-aCMs (N) and TTNΔ9/Δ9-hiPSC-aCMs (O) with insets (N′, O′). Scale bar: (N, O) 30 μm; (N′, O′) 15 μm. (P and Q) Representative TEM images of TTN+/+-hiPSC-aCMs and TTNΔ9/Δ9-hiPSC-aCMs. (R–T) Quantification of sarcomeric length in TTN+/+-hiPSC-aCMs and TTNΔ9/Δ9-hiPSC-aCMs (n = 3 independent batches, n = 8–9 cells per batch). (S–T) Measurement of non-cortical actinin alignment against perpendicular and parallel axes of TTN+/+-hiPSC-aCMs and TTNΔ9/Δ9-hiPSC-aCMs (n = 3 independent batches, n = 2–3 cells per batch). Data in (C, F, I, R, and T) are represented as mean ±95% confidence intervals. ∗p < 0.05; ∗∗p < 0.01; ∗∗∗∗p < 0.0001. See also Figures S3–S6 . |