
- Title
-
Artemvulactone E isolated from Artemisia vulgaris L. ameliorates lipopolysaccharide-induced inflammation in both RAW264.7 and zebrafish model
- Authors
- Zhao, Z., Lin, S., Liu, T., Hu, X., Qin, S., Zhan, F., Ma, J., Huang, C., Huang, Z., Wang, Y., Zheng, K., Zhang, W., Ren, Z.
- Source
- Full text @ Front Pharmacol

Structure and cytotoxicity of AE. (A) Molecular structure of AE. (B) RAW264.7 cells were treated with AE at different concentrations for 12 h and 24 h and cell viability was determined. |
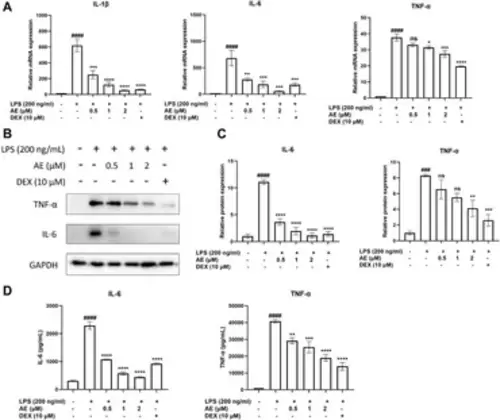
The anti-inflammatory effects of AE on RAW 264.7 cells. (A) RAW264.7 were treated with LPS and different concentration of AE for 12 h and then RT-qPCR was performed. (B) RAW264.7 were treated with LPS and AE for 12 h, and then Western blot was performed. (C) Relative protein expression levels of TNF-α and IL-6. (D) RAW264.7 were treated with LPS and AE for 24 h, and TNF-α and IL-6 release was measured in the culture supernatants. Data were represented as mean ± SEM (n = 3), *p < 0.05; **p < 0.01; ***p < 0.001;****p < 0.0001; ns, no significance, compared with each’group. ###p < 0.001; ####p < 0.0001; compared with Ctrl group. |
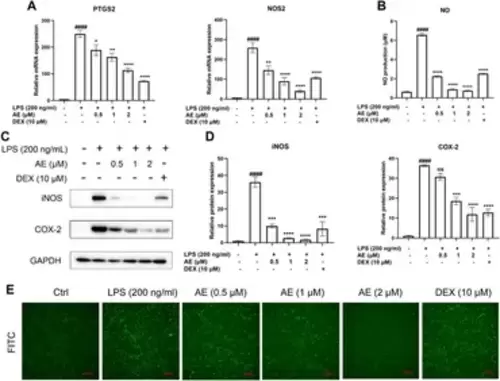
AE decreases LPS-stimulated iNOS, COX-2 and ROS generation. (A) Changes in mRNA level expression of NOS2 and PTGS2. (B) NO release was measured in the culture supernatants by Griess reagent. (C) RAW264.7 were treated with LPS and AE for 12 h, and then Western blot was performed. (D) Relative protein expression levels of iNOS and COX-2. (E) The ROS generation level RAW264.7 were treated with LPS and AE for 12 h. Data were represented as mean ± SEM (n = 3), *p < 0.05; **p < 0.01; ***p < 0.001;****p < 0.0001; ns, no significance, compared with each’group. ##p < 0.01; ###p < 0.001; ####p < 0.0001; compared with Ctrl group. |

Inhibitory effects of AE on the activation of MAPK and STAT3. (A,C) RAW264.7 were treated with LPS and AE for 12h, and Western blot was then performed (B,D) Relative protein expression levels of p-JNK, or p-JAK2 and p-STAT3. Data were represented as mean ± SEM (n = 3), *p < 0.05; **p < 0.01; ***p < 0.001;****p < 0.0001; ns, no significance, compared with each’group. ##p < 0.01; ###p < 0.001; ####p < 0.0001; compared with Ctrl group. |
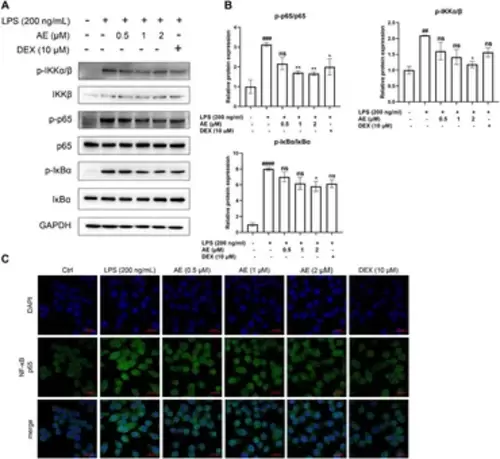
AE inhibits the activation of NF-κB. (A) RAW264.7 were treated with LPS and AE for 12 h, and Western blot was then performed. (B) Relative protein expression levels of p-IKKα/β, p-p65 and p-IκBα. (C) The cells were treated with LPS and AEfor 12 h, NF-κB p65 was immunostained with anti-p65 antibody and detected using secondary antibody conjugated with Alexa FluorTM 488 (green) followed by DAPI (blue) staining for nuclei. Scale bar, 20 μm. Data were represented as mean ± SEM (n = 3), *p < 0.05; **p < 0.01; ***p < 0.001;****p < 0.0001; ns, no significance, compared with each’group. ##p < 0.01; ###p < 0.001; ####p < 0.0001; compared with Ctrl group. |
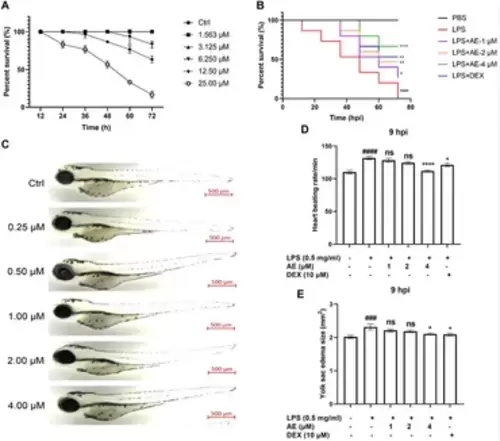
The protective effect of AE on zebrafish larvae microinjected with LPS. (A) 3 dpf larvae (n = 20) were immersed with different concentrations of AE for 72 h. The survival rate of zebrafish larvae was observed under a microscope (B) Lateral view of 3 dpf zebrafish larvae treated with AE for 24 h. Scale bar, 500 μm. (C) 3 dpf larvae (n = 15) were yolk-microinjected with PBS or LPS, and then treated with AE or DEX. Mortality was monitored until 72 hpi. (D) The heart-beating rate was counted at 9 hpi. (E) After 9 hpi the edema area of the yolk sac was tracked. Data were represented as mean ± SEM (n = 3), *p < 0.05; **p < 0.01; ***p < 0.001;****p < 0.0001; ns, no significance, compared with each’group. ##p < 0.01; ###p < 0.001; ####p < 0.0001; compared with Ctrl group. |
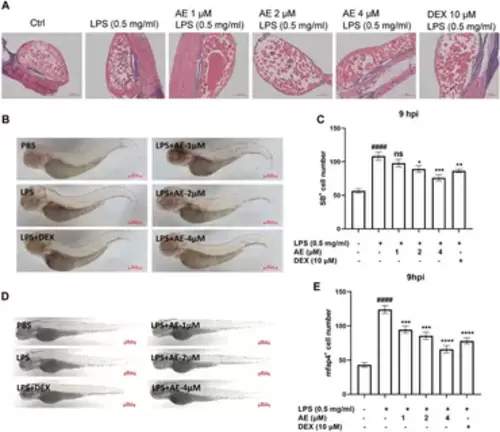
AE inhibits inflammatory cells recruitment in LPS-yolk microinjected zebrafish. (A) 3 dpf larvae (n = 15) were yolk-microinjected with PBS or LPS, and then treated with AE or DEX. The larvae were stained by H&E and taken pictures with a microscope, 20×. The black arrows represent inflammatory cells. (B) SB staining was performed at 9 hpi, 25×. (C) Statistical analysis of neutrophils in yolk sac of zebrafish larvae. (D) Whole-mount in situ hybridizations of mfap4 in zebrafish embryos at 9 hpi, 25×. (E) Statistical analysis of macrophages in yolk sac of zebrafish larvae. Data were represented as mean ± SD (n = 3), *p < 0.05; **p < 0.01; ***p < 0.001; ****p < 0.0001; ns, no significance, compared with each’ group. ##p < 0.01; ###p < 0.001; ####p < 0.0001; compared with Ctrl group. |
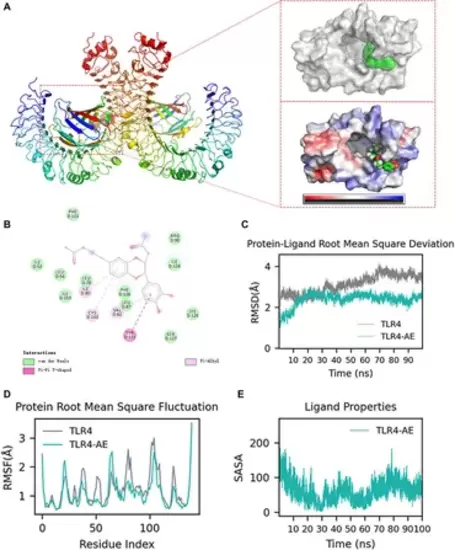
Molecular docking and molecular dynamics simulation analysis. (A) AE Docking Pockets and Electrostatics Analysis in Ribbon and Surface Forms. (B) Ligand-receptor interactions. (C) Root means square deviation of proteins and ligands over time. (D) Root means square fluctuation of protein residue index. (E) solvent-accessible surface area curve with time. |