
|
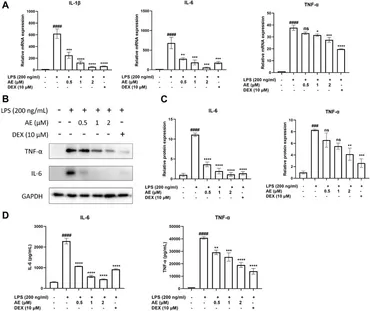
Fig. 2 The anti-inflammatory effects of AE on RAW 264.7 cells. (A) RAW264.7 were treated with LPS and different concentration of AE for 12 h and then RT-qPCR was performed. (B) RAW264.7 were treated with LPS and AE for 12 h, and then Western blot was performed. (C) Relative protein expression levels of TNF-α and IL-6. (D) RAW264.7 were treated with LPS and AE for 24 h, and TNF-α and IL-6 release was measured in the culture supernatants. Data were represented as mean ± SEM (n = 3), *p < 0.05; **p < 0.01; ***p < 0.001;****p < 0.0001; ns, no significance, compared with each’group. ###p < 0.001; ####p < 0.0001; compared with Ctrl group.