
|
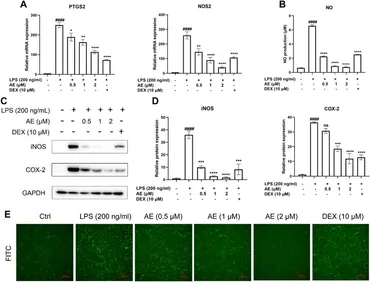
Fig. 3 AE decreases LPS-stimulated iNOS, COX-2 and ROS generation. (A) Changes in mRNA level expression of NOS2 and PTGS2. (B) NO release was measured in the culture supernatants by Griess reagent. (C) RAW264.7 were treated with LPS and AE for 12 h, and then Western blot was performed. (D) Relative protein expression levels of iNOS and COX-2. (E) The ROS generation level RAW264.7 were treated with LPS and AE for 12 h. Data were represented as mean ± SEM (n = 3), *p < 0.05; **p < 0.01; ***p < 0.001;****p < 0.0001; ns, no significance, compared with each’group. ##p < 0.01; ###p < 0.001; ####p < 0.0001; compared with Ctrl group.