
Image
|
Figure Caption
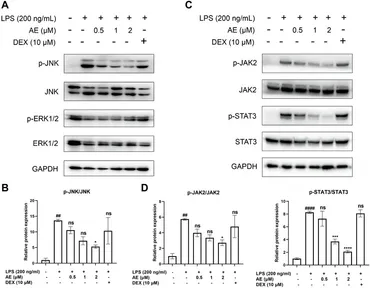
Fig. 4 Inhibitory effects of AE on the activation of MAPK and STAT3. (A,C) RAW264.7 were treated with LPS and AE for 12h, and Western blot was then performed (B,D) Relative protein expression levels of p-JNK, or p-JAK2 and p-STAT3. Data were represented as mean ± SEM (n = 3), *p < 0.05; **p < 0.01; ***p < 0.001;****p < 0.0001; ns, no significance, compared with each’group. ##p < 0.01; ###p < 0.001; ####p < 0.0001; compared with Ctrl group.
Acknowledgments
This image is the copyrighted work of the attributed author or publisher, and
ZFIN has permission only to display this image to its users.
Additional permissions should be obtained from the applicable author or publisher of the image.
Full text @ Front Pharmacol