
- Title
-
Use of zebrafish to identify host responses specific to type VI secretion system mediated interbacterial antagonism
- Authors
- Virgo, M., Mostowy, S., Ho, B.T.
- Source
- Full text @ PLoS Pathog.

V. cholerae T6SS antagonism towards E. coli reduces host survival. (A) Illustration of zebrafish larvae indicating the site of bacterial injection (HBV) and downstream analysis workflow. (B) Enumeration of recovered V. cholerae (Vc) at 0, 6, or 24 hpi from larvae infected with ~2000 CFU of WT or ΔT6SS V. cholerae. Circles represent individual larvae. Data were pooled from 3 independent experiments, each with 3–4 larvae per time point. Significance was assessed using unpaired t-test on Log10 transformed values. (C) Survival curves of larvae infected with ~2000 CFU of WT or ΔT6SS V. cholerae. Data were pooled from three independent experiments, each with 12–26 larvae. Significance was assessed using log-rank Mantel-Cox test. (D) Enumeration of recovered E. coli or V. cholerae at 0, 6, or 24 hpi from zebrafish larvae coinfected with a 1:1 mixture (~1500 CFU each) of E. coli and WT V. cholerae (Ec x Vc WT) or E. coli and ΔT6SS V. cholerae (Ec x Vc ΔT6). Circles represent individual larvae. Data were pooled from three independent experiments, each with 3–5 larvae per time point. Significance was assessed using an unpaired t-test on Log10 transformed values. (E) Survival curves of larvae coinfected with a 1:1 mixture (~1500 CFU each) of either E. coli and WT V. cholerae (Ec x Vc WT) or E. coli and ΔT6SS V. cholerae (Ec x Vc ΔT6). Data were pooled from three independent experiments, each with 13–24 larvae. Significance was assessed by log-rank Mantel-Cox test. For all panels, bars indicate mean ± SEM. *p < 0.05, **p < 0.01, ***p < 0.001, ****p<0.0001, and ns (not significant). https://doi.org/10.1371/journal.ppat.1012384.g001 |
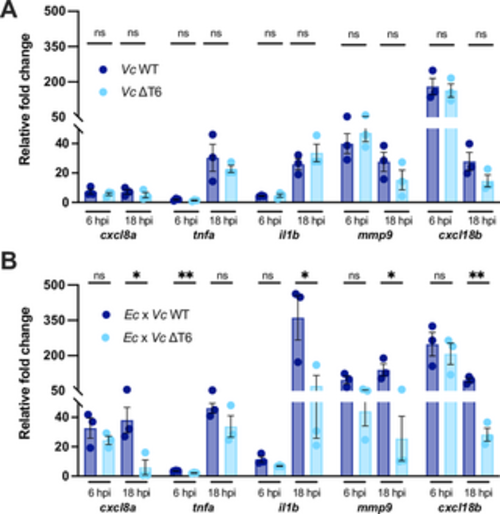
V. cholerae T6SS-mediated antagonism towards E. coli induces host inflammation. (A) Fold change in the expression of cxcl8a, tnfa, il1b, mmp9 and cxcl18b in larvae infected with ~2000 CFU of WT or ΔT6SS V. cholerae relative to mock infected larvae at 6 hpi or 18 hpi. Data were pooled from three independent experiments, each with 12–15 larvae per time point. Significance was assessed using unpaired t-test on Log2 transformed values. (B) Fold change in the expression of cxcl8a, tnfa, il1b, mmp9 and cxcl18b in larvae coinfected with a 1:1 mixture (~1500 CFU each) of either E. coli and WT V. cholerae (Ec x Vc WT) or E. coli and ΔT6SS V. cholerae (Ec x Vc ΔT6) relative to mock infected larvae at 6 hpi or 18 hpi. Data were pooled from three independent experiments, each with 10–15 larvae per time point. Significance was assessed using unpaired t-test Log2 on transformed values. For all panels, bars indicate mean ± SEM. *p < 0.05, **p < 0.01, and ns (not significant). https://doi.org/10.1371/journal.ppat.1012384.g002 |
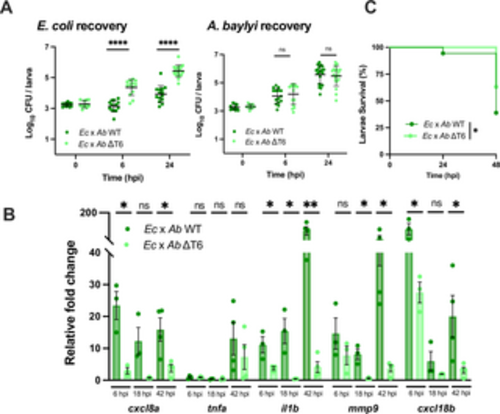
A. baylyi T6SS-medatied antagonism towards E. coli induces host inflammation and reduces host survival. (A) Enumeration of recovered E. coli or A. baylyi at 0, 6, or 24 hpi from zebrafish larvae coinfected with a 1:1 mixture (~2000 CFU each) of E. coli and WT A. baylyi (Ec x Ab WT) or E. coli and ΔT6SS A. baylyi (Ec x Ab ΔT6). Circles represent individual larvae. Data were pooled from three independent experiments, each with 3–5 larvae per time point. Significance was assessed using unpaired t-test on Log10 transformed values. (B) Fold change in the expression of cxcl8a, tnfa, il1b, mmp9 and cxcl18b in larvae coinfected with a 1:1 mixture (~2000 CFU each) of either E. coli and WT A. baylyi (Ec x Ab WT) or E. coli and ΔT6SS A. baylyi (Ec x Ab ΔT6SS) relative to mock infected larvae at 6 hpi, 18 hpi, or 42 hpi. Data were pooled from three independent experiments, each with 10–15 larvae per time point. Significance was assessed using unpaired t-test on Log2 transformed values. (C) Survival curves of larvae coinfected with a 1:1 mixture (~2000 CFU each) of either E. coli and WT A. baylyi (Ec x Ab WT) or E. coli and ΔT6SS A. baylyi (Ec x Ab ΔT6). Data were pooled from three independent experiments, each with 10–15 larvae. Significance was assessed by log-rank Mantel-Cox test. For all panels, bars indicate mean ± SEM. *p < 0.05, ****p<0.0001, and ns (not significant). https://doi.org/10.1371/journal.ppat.1012384.g003 |
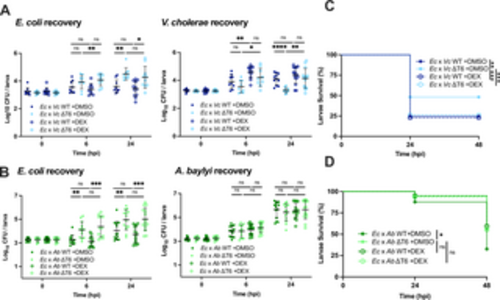
Dexamethasone treatment eliminates T6SS-dependent effects on host survival. (A) Enumeration of recovered E. coli or V. cholerae at 0, 6, or 24 hpi from zebrafish larvae coinfected with a 1:1 mixture (~1500 CFU each) of E. coli and WT V. cholerae (Ec x Vc WT) or E. coli and ΔT6SS V. cholerae (Ec x Vc ΔT6), then immersed in 50 μg/mL dexamethasone (DEX) or solvent control (DMSO). Circles represent individual larvae. Data were pooled from three independent experiments, each with 3 larvae per time point. Significance was assessed by unpaired t-test on Log10 transformed values. (B) Enumeration of recovered E. coli or A. baylyi at 0, 6, or 24 hpi from larvae coinfected with a 1:1 mixture (~2000 CFU each) of E. coli and WT A. baylyi (Ec x Ab WT) or E. coli and ΔT6SS A. baylyi (Ec x Ab ΔT6), then immersed in 50 μg/mL DEX or DMSO. Circles represent individual larvae. Data were pooled from three independent experiments, each with 3 larvae per time point. Significance was assessed by unpaired t-test on Log10 transformed values. (C) Survival curves of larvae coinfected with a 1:1 mixture (~1500 CFU each) of E. coli and WT V. cholerae (Ec x Vc WT) or E. coli and ΔT6SS V. cholerae (Ec x Vc ΔT6), then immersed in 50 μg/mL dexamethasone (DEX) or solvent control (DMSO). Data are pooled from four independent experiments, each with 13–29 larvae. Significance was assessed by log-rank Mantel-Cox test. (D) Survival curves of larvae coinfected with a 1:1 mixture (~2000 CFU each) of E. coli and WT A. baylyi (Ec x Ab WT) or E. coli and ΔT6SS A. baylyi (Ec x Ab ΔT6), then immersed in 50 μg/mL dexamethasone (DEX) or solvent control (DMSO). Data are pooled from three independent experiments, each with 10–25 larvae. Significance was assessed by log-rank Mantel-Cox test. For all panels, bars indicate mean ± SEM. *p < 0.05, **p < 0.01, ***p < 0.001, ****p<0.0001, and ns (not significant). https://doi.org/10.1371/journal.ppat.1012384.g004 |
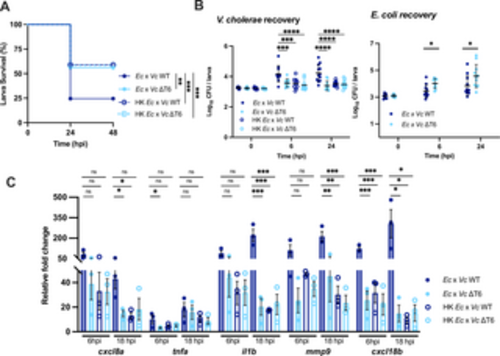
Heat-killed E. coli lysate does not enhance V. cholerae pathogenicity in the absence of T6SS-mediated killing. (A) Survival curves of larvae coinfected with a 1:1 mixture of E. coli (Ec) or heat-killed E. coli lysate (HK Ec) with WT V. cholerae (Vc WT) or ΔT6SS V. cholerae (Vc ΔT6) (~1500 CFU each). Data are pooled from three independent experiments, each with 11–20 larvae. Significance was assessed by log-rank Mantel-Cox test. (B) Enumeration of recovered V. cholerae or E. coli at 0, 6, or 24 hpi from zebrafish larvae coinfected with a 1:1 mixture of E. coli (Ec) or heat-killed E. coli lysate (HK Ec) with WT V. cholerae (Vc WT) or ΔT6SS V. cholerae (Vc ΔT6) (~1500 CFU each). Circles represent individual larvae. Data were pooled from three independent experiments, each with 3–5 larvae per time point. Significance was assessed by unpaired t-test on Log10 transformed values. (C) Fold change in the expression of cxcl8a, tnfa, il1b, mmp9 and cxcl18b in larvae coinfected with 1:1 mixture of E. coli (Ec) or heat-killed E. coli lysate (HK Ec) with WT V. cholerae (Vc WT) or ΔT6SS V. cholerae (Vc ΔT6) (~1500 CFU each) relative to mock infected larvae at 6 hpi or 18 hpi. Data were pooled from three independent experiments, each with 10–15 larvae per time point. Significance was assessed by one-way ANOVA with Tukey’s multiple comparisons test on Log2 transformed values. For all panels, bars indicate mean ± SEM. *p < 0.05, **p < 0.01, ***p < 0.001, ****p<0.0001, and ns (not significant). https://doi.org/10.1371/journal.ppat.1012384.g005 |
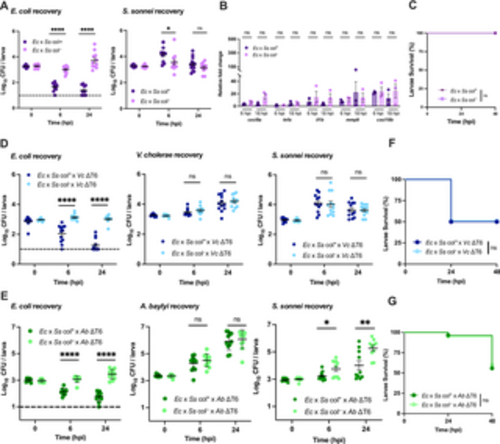
Colicin-mediated antagonism does not impact host viability. (A) Enumeration of recovered E. coli or S. sonnei at 0, 6, or 24 hpi from zebrafish larvae coinfected with a 1:1 mixture (~2000 CFU each) of E. coli (Ec) and S. sonnei (Ss) either producing (col+) or not producing (col–) colicin. Circles represent individual larvae. Data were pooled from three independent experiments, each with 3–4 larvae per time point. Significance was assessed by unpaired t-test on Log10 transformed values. (B) Fold change in the expression of cxcl8a, tnfa, il1b, mmp9 and cxcl18b in larvae coinfected with a 1:1 mixture (~2000 CFU each) of E. coli (Ec) and S. sonnei (Ss) either producing (col+) or not producing (col–) colicin relative to mock infected larvae at 6 hpi or 18 hpi. Data were pooled from three independent experiments, each with 10–15 larvae per time point. Significance was assessed using unpaired t-test on Log2 transformed values. (C) Survival curves of larvae coinfected with a 1:1 mixture (~2000 CFU each) of E. coli (Ec) and S. sonnei (Ss) either producing (col+) or not producing (col–) colicin. There was no larvae death for either condition. Data were pooled from three independent experiments, each with 12–14 larvae. Significance was assessed by log-rank Mantel-Cox test. (D) Enumeration of recovered E. coli, S. sonnei and V. cholerae at 0, 6, or 24 hpi from larvae coinfected with a 1:1:2 mixture of E. coli (Ec, ~750 CFU), S. sonnei (Ss, ~750 CFU) either producing (col+) or not producing (col–) colicin, and T6SS-defective V. cholerae (Vc ΔT6, ~1500 CFU). Circles represent individual larvae. Data were pooled from three independent experiments, each with 3–4 larvae per time point. Significance was assessed by unpaired t-test on Log10 transformed values. (E) Enumeration of recovered E. coli, S. sonnei and A. baylyi at 0, 6, or 24 hpi from larvae coinfected with a 1:1:2 mixture of E. coli (Ec, ~1000 CFU), S. sonnei (Ss, ~1000 CFU) either producing (col+) or not producing (col–) colicin, and T6SS-defective A. baylyi (Ab ΔT6, ~2000 CFU). Circles represent individual larvae. Data were pooled from three independent experiments, each with 3–4 larvae per time point. Significance was assessed by unpaired t-test on Log10 transformed values. (F) Survival curves of larvae coinfected with a 1:1:2 mixture of E. coli (Ec, ~750 CFU), S. sonnei (Ss, ~750 CFU) either producing (col+) or not producing (col–) colicin, and ΔT6SS V. cholerae (Vc ΔT6, ~1500 CFU). Data were pooled from three independent experiments, each with 18–25 larvae. Significance was assessed by log-rank Mantel-Cox test. (G) Survival curves of larvae coinfected with a 1:1:2 mixture of E. coli (Ec, ~1000 CFU), S. sonnei (Ss, ~1000 CFU) either producing (col+) or not producing (col–) colicin, and ΔT6SS A. baylyi (Ab ΔT6, ~2000 CFU). Data were pooled from three independent experiments, each with 18–25 larvae. Significance was assessed by log-rank Mantel-Cox test. The dashed lines in A, D, and E, indicate the limit of detection of the assay. When no bacteria were recovered, the cell count was assigned this value for statistical analysis. For all panels, bars indicate mean ± SEM. *p < 0.05, **p < 0.01, ****p<0.0001, and ns (not significant). https://doi.org/10.1371/journal.ppat.1012384.g006 |
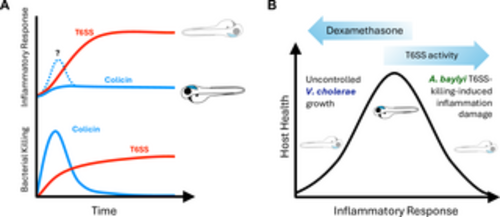
Model for interbacterial antagonism induced inflammation and impact on host survival. (A) Colicin-mediated killing is very effective at eliminating targeted bacteria. Because this killing is so rapid, if there are host inflammatory responses to the killed bacteria, they are short-lived, enabling the host to fully recover. T6SS is less efficient and therefore results in continuous bacterial killing and prolonged inflammatory response. (B) Health requires a balanced inflammatory response: too little enables uncontrolled pathogen growth, but too much results in host cellular damage. T6SS-mediated bacterial killing by different bacterial species impacts different parts of this scale. On one end, T6SS-induced inflammation sensitizes the host to less inherently pathogenic bacteria like A. baylyi, while on the other, suppression of inflammation by corticosteroids like dexamethasone allows pathogens like V. cholerae to grow uncontrolled. T6SS-mediated killing by V. cholerae exist in a unique place where the heightened inflammatory response it induces counterintuitively also enables it to grow unchecked. https://doi.org/10.1371/journal.ppat.1012384.g007 |