
Fig. 4
- ID
- ZDB-FIG-240731-31
- Publication
- Virgo et al., 2024 - Use of zebrafish to identify host responses specific to type VI secretion system mediated interbacterial antagonism
- Other Figures
- All Figure Page
- Back to All Figure Page
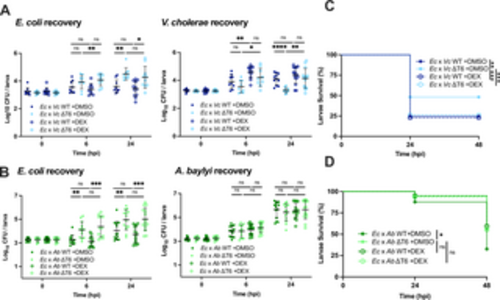
Dexamethasone treatment eliminates T6SS-dependent effects on host survival. (A) Enumeration of recovered E. coli or V. cholerae at 0, 6, or 24 hpi from zebrafish larvae coinfected with a 1:1 mixture (~1500 CFU each) of E. coli and WT V. cholerae (Ec x Vc WT) or E. coli and ΔT6SS V. cholerae (Ec x Vc ΔT6), then immersed in 50 μg/mL dexamethasone (DEX) or solvent control (DMSO). Circles represent individual larvae. Data were pooled from three independent experiments, each with 3 larvae per time point. Significance was assessed by unpaired t-test on Log10 transformed values. (B) Enumeration of recovered E. coli or A. baylyi at 0, 6, or 24 hpi from larvae coinfected with a 1:1 mixture (~2000 CFU each) of E. coli and WT A. baylyi (Ec x Ab WT) or E. coli and ΔT6SS A. baylyi (Ec x Ab ΔT6), then immersed in 50 μg/mL DEX or DMSO. Circles represent individual larvae. Data were pooled from three independent experiments, each with 3 larvae per time point. Significance was assessed by unpaired t-test on Log10 transformed values. (C) Survival curves of larvae coinfected with a 1:1 mixture (~1500 CFU each) of E. coli and WT V. cholerae (Ec x Vc WT) or E. coli and ΔT6SS V. cholerae (Ec x Vc ΔT6), then immersed in 50 μg/mL dexamethasone (DEX) or solvent control (DMSO). Data are pooled from four independent experiments, each with 13–29 larvae. Significance was assessed by log-rank Mantel-Cox test. (D) Survival curves of larvae coinfected with a 1:1 mixture (~2000 CFU each) of E. coli and WT A. baylyi (Ec x Ab WT) or E. coli and ΔT6SS A. baylyi (Ec x Ab ΔT6), then immersed in 50 μg/mL dexamethasone (DEX) or solvent control (DMSO). Data are pooled from three independent experiments, each with 10–25 larvae. Significance was assessed by log-rank Mantel-Cox test. For all panels, bars indicate mean ± SEM. *p < 0.05, **p < 0.01, ***p < 0.001, ****p<0.0001, and ns (not significant). https://doi.org/10.1371/journal.ppat.1012384.g004 |