
|
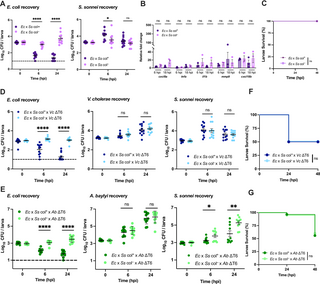
Fig. 6 Colicin-mediated antagonism does not impact host viability. (A) Enumeration of recovered E. coli or S. sonnei at 0, 6, or 24 hpi from zebrafish larvae coinfected with a 1:1 mixture (~2000 CFU each) of E. coli (Ec) and S. sonnei (Ss) either producing (col+) or not producing (col–) colicin. Circles represent individual larvae. Data were pooled from three independent experiments, each with 3–4 larvae per time point. Significance was assessed by unpaired t-test on Log10 transformed values. (B) Fold change in the expression of cxcl8a, tnfa, il1b, mmp9 and cxcl18b in larvae coinfected with a 1:1 mixture (~2000 CFU each) of E. coli (Ec) and S. sonnei (Ss) either producing (col+) or not producing (col–) colicin relative to mock infected larvae at 6 hpi or 18 hpi. Data were pooled from three independent experiments, each with 10–15 larvae per time point. Significance was assessed using unpaired t-test on Log2 transformed values. (C) Survival curves of larvae coinfected with a 1:1 mixture (~2000 CFU each) of E. coli (Ec) and S. sonnei (Ss) either producing (col+) or not producing (col–) colicin. There was no larvae death for either condition. Data were pooled from three independent experiments, each with 12–14 larvae. Significance was assessed by log-rank Mantel-Cox test. (D) Enumeration of recovered E. coli, S. sonnei and V. cholerae at 0, 6, or 24 hpi from larvae coinfected with a 1:1:2 mixture of E. coli (Ec, ~750 CFU), S. sonnei (Ss, ~750 CFU) either producing (col+) or not producing (col–) colicin, and T6SS-defective V. cholerae (Vc ΔT6, ~1500 CFU). Circles represent individual larvae. Data were pooled from three independent experiments, each with 3–4 larvae per time point. Significance was assessed by unpaired t-test on Log10 transformed values. (E) Enumeration of recovered E. coli, S. sonnei and A. baylyi at 0, 6, or 24 hpi from larvae coinfected with a 1:1:2 mixture of E. coli (Ec, ~1000 CFU), S. sonnei (Ss, ~1000 CFU) either producing (col+) or not producing (col–) colicin, and T6SS-defective A. baylyi (Ab ΔT6, ~2000 CFU). Circles represent individual larvae. Data were pooled from three independent experiments, each with 3–4 larvae per time point. Significance was assessed by unpaired t-test on Log10 transformed values. (F) Survival curves of larvae coinfected with a 1:1:2 mixture of E. coli (Ec, ~750 CFU), S. sonnei (Ss, ~750 CFU) either producing (col+) or not producing (col–) colicin, and ΔT6SS V. cholerae (Vc ΔT6, ~1500 CFU). Data were pooled from three independent experiments, each with 18–25 larvae. Significance was assessed by log-rank Mantel-Cox test. (G) Survival curves of larvae coinfected with a 1:1:2 mixture of E. coli (Ec, ~1000 CFU), S. sonnei (Ss, ~1000 CFU) either producing (col+) or not producing (col–) colicin, and ΔT6SS A. baylyi (Ab ΔT6, ~2000 CFU). Data were pooled from three independent experiments, each with 18–25 larvae. Significance was assessed by log-rank Mantel-Cox test. The dashed lines in A, D, and E, indicate the limit of detection of the assay. When no bacteria were recovered, the cell count was assigned this value for statistical analysis. For all panels, bars indicate mean ± SEM. *p < 0.05, **p < 0.01, ****p<0.0001, and ns (not significant). https://doi.org/10.1371/journal.ppat.1012384.g006