
- Title
-
ULI-ssDRIP-seq revealed R-loop dynamics during vertebrate early embryogenesis
- Authors
- Xu, W., Liu, X., Li, J., Sun, C., Chen, L., Zhou, J., Li, K., Li, Q., Meng, A., Sun, Q.
- Source
- Full text @ Cell Insight
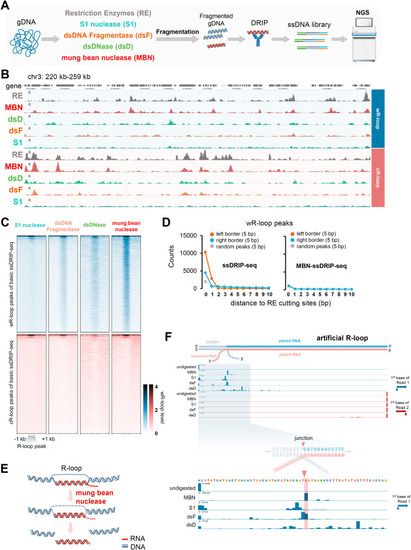
Improvements of ssDRIP-seq by optimizing the genomic DNA fragmentation. A. Schematic of the exploration experiment for the improvement of ssDRIP-seq. Briefly, the gDNA digestion step was first performed by using S1 nuclease, dsDNA Fragmentase, dsDNase, mung bean nuclease, and restriction enzymes. Then gDNA was fragmented by sonication, followed by DRIP, ssDNA library preparation, and sequencing. B. IGV snapshot of Arabidopsis wR-loop (Watson R-loop, with a Watson strand DNA as the unpaired ssDNA) and cR-loop (Crick R-loop, with a Crick strand DNA as the unpaired ssDNA) signals from basic ssDRIP-seq using restriction enzymes (RE, grey) and other modified ssDRIP-seq using mung bean nuclease (MBN, red), dsDNase (dsD, light green), dsDNA Fragmentase (dsF, brown), or S1 nuclease (S1, cyan) for gDNA treatment. C. Heatmaps of Arabidopsis wR-loop signals of modified ssDRIP-seq using S1 nuclease, dsDNA Fragmentase, dsDNase, or mung bean nuclease. The signals around wR-loop (upper, blue) or cR-loop (lower, red) peaks of basic ssDRIP-seq were shown. D. Statistics of boundaries of wR-loop peaks (extended ± 5 bp) from basic ssDRIP-seq (left) or MBN-ssDRIP-seq (right, modified ssDRIP-seq using mung bean nuclease) with different distances from restriction enzyme cutting sites (DdeI, MseI, NlaIII and MboI). 0 bp means overlapping. E. Supposed model of R-loop treatment by mung bean nuclease. F. MBN-ssDRIP-seq result of artificial half R-loop (seen in Fig. S1H). The artificial R-loop was first treated with mung bean nuclease (MBN), S1 nuclease(S1), dsDNA Fragmentase (dsF), or dsDNase (dsD), followed by DRIP and ssDNA library preparation. IGV snapshot showed the counts of the first bases of Watson (blue) and Crick (red) reads. The junction and expected boundaries was marked by red triangle and red shadow respectively. |
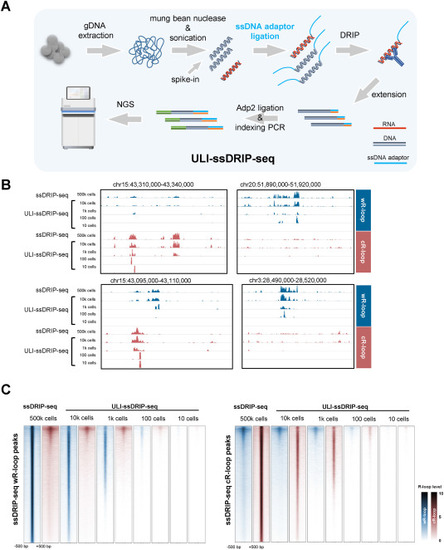
Establishment of ULI-ssDRIP-seq, the R-loop profiling method for Ultra-low-input samples. A. Schematic of workflow of ULI-ssDRIP-seq method. B. IGV snapshots of zebrafish wR-loop (blue) and cR-loop (red) signals from ssDRIP-seq and ULI-ssDRIP-seq with different quantities of input. C. Metaplots and heatmaps of zebrafish wR-loop (blue) and cR-loop (red) signals from ssDRIP-seq (500k cells) and ULI-ssDRIP-seq with different quantities of input (10k, 1k, 100, or 10 cells). The signals around wR-loop (left) and cR-loop (right) peaks of 500k cells ssDRIP-seq were shown. |
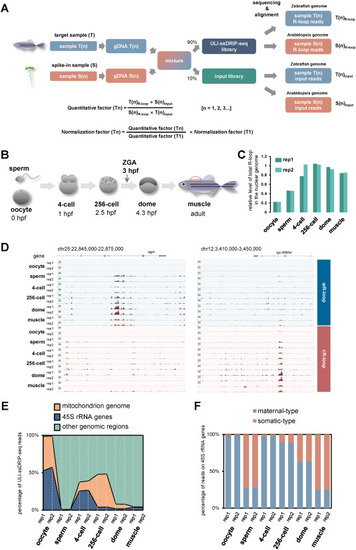
R-loop landscapes during parental-to-zygotic transition. A. Schematic of the quantification method used in ULI-ssDRIP-seq. B. Schematic of early developmental stages examined in this study, including sperm, oocyte, 4-cell, 256-cell, dome stages and dorsal muscle (marked with red circle) from adult fish. Hours post fertilization, hpf. C. Relative levels of total R-loops in the nuclear genome from two biological replications of oocyte, sperm, 4-cell, 256-cell, dome, and muscle groups respectively. D. IGV snapshots of wR-loop and cR-loop signals from oocytes, sperms, 4-cell, 256-cell, dome embryos, and muscles (T1). E. Percentages of ULI-ssDRIP-seq reads from two biological replications of oocyte, sperm, 4-cell, 256-cell, dome, and muscle groups, mapped to the mitochondrial, 45S rRNA genes, or other genomic regions. F. Percentages of ULI-ssDRIP-seq reads from two biological replications of oocyte, sperm, 4-cell, 256-cell, dome, and muscle groups, mapped to maternal-type or somatic-type 45S rRNA genes. |
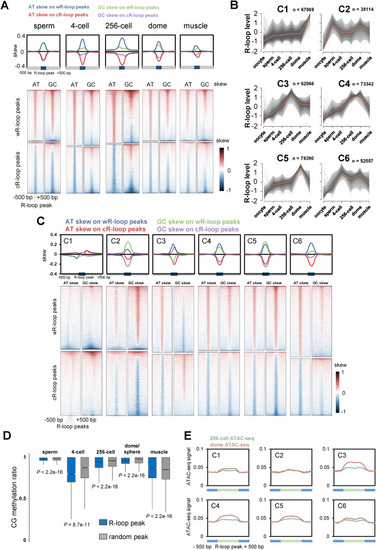
Characteristics of R-loop dynamics during early development. A. Metaplots (upper) and heatmaps (lower) of AT or GC skew around R-loop peaks of sperm, 4-cell, 256-cell, dome and muscle groups. B. Fuzzy cluster analysis of R-loop signals by using Mfuzz. Line plots show ULI-ssDRIP-seq signals, with individual loci (grey lines) and values of the cluster center (orange line). The count of R-loop peaks from each cluster is shown as “n”. R-loop peak locations of each cluster are shown in Table S4. C. Metaplots (upper) and heatmaps (lower) of AT or GC skew around R-loop peaks of clusters 1 to 6 shown in Fig. 4B. D. Box plot of CG methylation levels (SRP020008) on R-loop peaks (blue) or random peaks (grey) in sperm, muscle, and 4-cell, 256-cell, dome/sphere stage embryos. As sphere-stage is very close to dome stage, the CG methylation pattern at sphere stage is analyzed with R-loop peaks at dome stage. P values were calculated using Mann-Whitney U test. E. Metaplots of ATAC-seq signals (GSE101779) around six R-loop clusters (Fig. 4B) in zebrafish embryos at 256-cell or dome stage. |
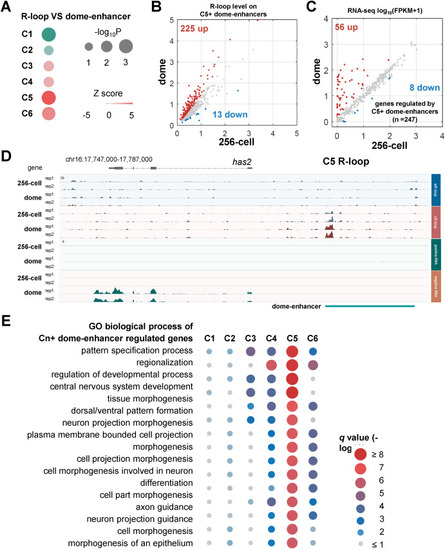
Correlation between R-loops and enhancers during early development. A. Permutation test results of correlations between enhancers at dome stage (represented as dome-enhancer, GSE114954) and six R-loop clusters shown in Fig. 4B B. Scatter plot of R-loop levels at 256-cell and dome stages on enhancers overlapping with C5 R-loop (represented as C5+ dome-enhancers). Up, log2FC > 0.5 (dome/256-cell), red. Down, log2FC < −0.5 (dome/256-cell), blue. C. Scatter plot of RNA expression levels [log10(FPKM+1)] of genes regulated by C5+ dome-enhancers. “Regulated” was defined as the nearest genes from enhancers. Up, log2FC > 1 (dome/256-cell), red. Down, log2FC < −1 (dome/256-cell), blue. D. IGV snapshot of strand-specific ULI-ssDRIP-seq (upper) and RNA-seq (lower) signals around has2 gene at 256-cell and dome stages. C5 R-loop and dome-enhancer were shown. E. Gene Ontology (GO) biological process analysis results of genes regulated by dome-enhancers overlapping with each R-loop cluster (represented as Cn + dome-enhancers). The q values were shown. |
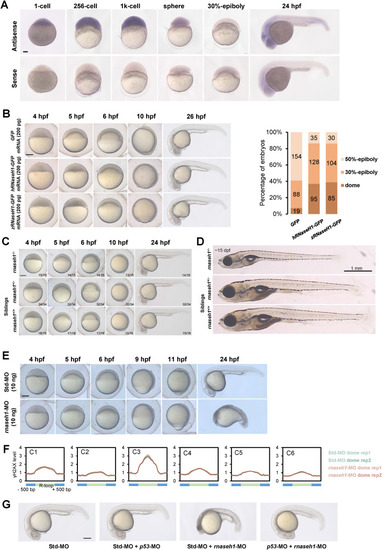
Balanced R-loop dynamics ensures active zygotic gene expression and secure early embryonic development. A. Spatiotemporal expression pattern of rnaseh1. Embryos were laterally viewed with animal pole to the top or with anterior to the left. Scale bars, 100 μm. B. Left, representative embryos from GFP-injected, hRNaseH1-GFP-injected and zRNaseH1-GFP-injected groups. Scale bars, 200 μm. Right, the ratio of embryos with different development stages at 5.5 hpf. C. Representative embryos of rnaseh1 homozygous mutants with siblings at early development stages. The ratio of zebrafish with the similar results is indicated. Scale bars, 200 μm. D. Representative fish of rnaseh1 homozygous mutants with siblings at 15 dpf. Scale bars, 1 mm. E. Representative embryos from 10 ng Std-MO-injected and 10 ng rnaseh1-MO-injected groups. Scale bars, 200 μm. F. Metaplots of γH2AX stacc-seq signals around six R-loop clusters (Fig. 4B) in Std-MO and rnaseh1-MO embryos at dome stage. G. Morphology of rnaseh1-knowdown embryos coinjected with p53-MO compared to the control embryos at 24 hpf. Scare bar = 200 μm. |