
Image
|
Figure Caption
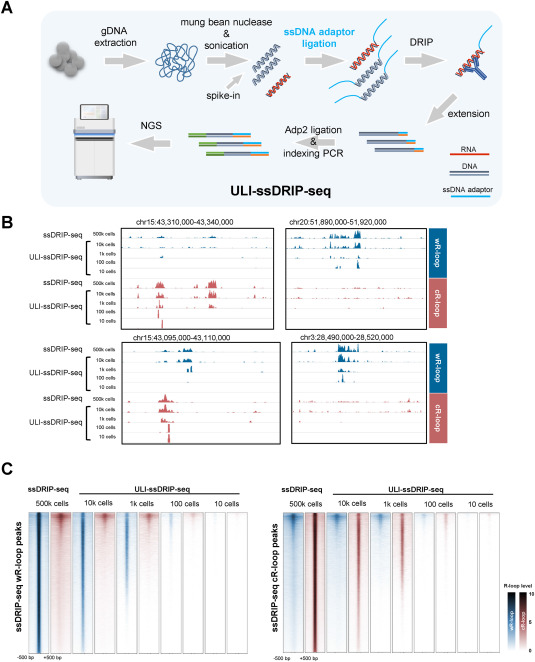
Fig. 2 Establishment of ULI-ssDRIP-seq, the R-loop profiling method for Ultra-low-input samples. A. Schematic of workflow of ULI-ssDRIP-seq method. B. IGV snapshots of zebrafish wR-loop (blue) and cR-loop (red) signals from ssDRIP-seq and ULI-ssDRIP-seq with different quantities of input. C. Metaplots and heatmaps of zebrafish wR-loop (blue) and cR-loop (red) signals from ssDRIP-seq (500k cells) and ULI-ssDRIP-seq with different quantities of input (10k, 1k, 100, or 10 cells). The signals around wR-loop (left) and cR-loop (right) peaks of 500k cells ssDRIP-seq were shown.
Acknowledgments
This image is the copyrighted work of the attributed author or publisher, and
ZFIN has permission only to display this image to its users.
Additional permissions should be obtained from the applicable author or publisher of the image.
Full text @ Cell Insight