
|
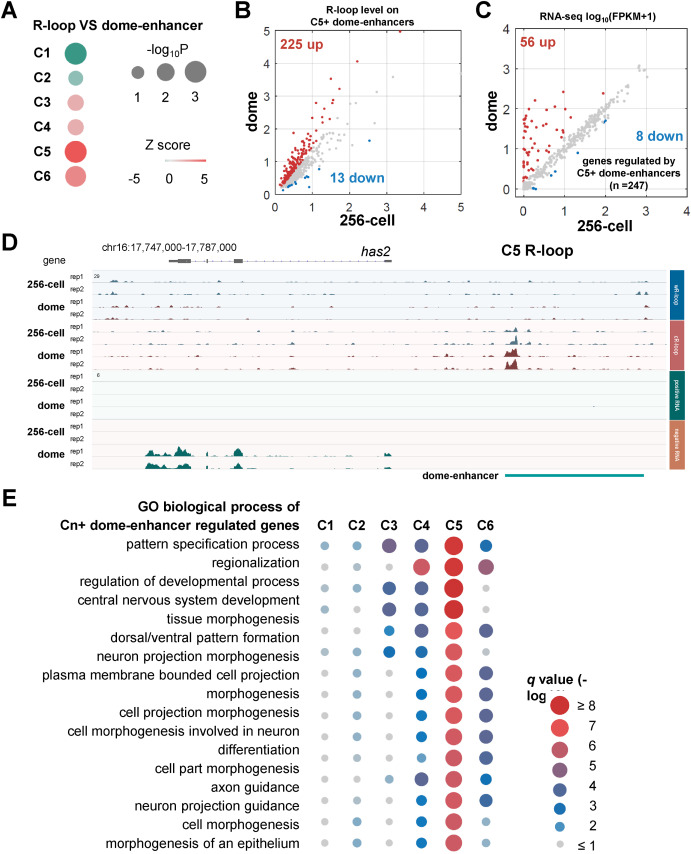
Fig. 5 Correlation between R-loops and enhancers during early development. A. Permutation test results of correlations between enhancers at dome stage (represented as dome-enhancer, GSE114954) and six R-loop clusters shown in Fig. 4B B. Scatter plot of R-loop levels at 256-cell and dome stages on enhancers overlapping with C5 R-loop (represented as C5+ dome-enhancers). Up, log2FC > 0.5 (dome/256-cell), red. Down, log2FC < −0.5 (dome/256-cell), blue. C. Scatter plot of RNA expression levels [log10(FPKM+1)] of genes regulated by C5+ dome-enhancers. “Regulated” was defined as the nearest genes from enhancers. Up, log2FC > 1 (dome/256-cell), red. Down, log2FC < −1 (dome/256-cell), blue. D. IGV snapshot of strand-specific ULI-ssDRIP-seq (upper) and RNA-seq (lower) signals around has2 gene at 256-cell and dome stages. C5 R-loop and dome-enhancer were shown. E. Gene Ontology (GO) biological process analysis results of genes regulated by dome-enhancers overlapping with each R-loop cluster (represented as Cn + dome-enhancers). The q values were shown.