
Fig. 6
- ID
- ZDB-FIG-240709-23
- Publication
- Xu et al., 2024 - ULI-ssDRIP-seq revealed R-loop dynamics during vertebrate early embryogenesis
- Other Figures
- All Figure Page
- Back to All Figure Page
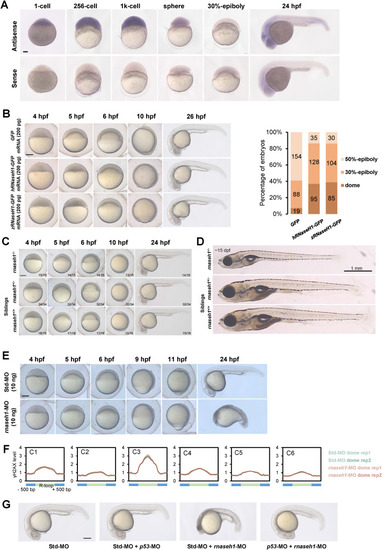
Balanced R-loop dynamics ensures active zygotic gene expression and secure early embryonic development. A. Spatiotemporal expression pattern of rnaseh1. Embryos were laterally viewed with animal pole to the top or with anterior to the left. Scale bars, 100 μm. B. Left, representative embryos from GFP-injected, hRNaseH1-GFP-injected and zRNaseH1-GFP-injected groups. Scale bars, 200 μm. Right, the ratio of embryos with different development stages at 5.5 hpf. C. Representative embryos of rnaseh1 homozygous mutants with siblings at early development stages. The ratio of zebrafish with the similar results is indicated. Scale bars, 200 μm. D. Representative fish of rnaseh1 homozygous mutants with siblings at 15 dpf. Scale bars, 1 mm. E. Representative embryos from 10 ng Std-MO-injected and 10 ng rnaseh1-MO-injected groups. Scale bars, 200 μm. F. Metaplots of γH2AX stacc-seq signals around six R-loop clusters (Fig. 4B) in Std-MO and rnaseh1-MO embryos at dome stage. G. Morphology of rnaseh1-knowdown embryos coinjected with p53-MO compared to the control embryos at 24 hpf. Scare bar = 200 μm. |