
Fig. 4
- ID
- ZDB-FIG-240709-21
- Publication
- Xu et al., 2024 - ULI-ssDRIP-seq revealed R-loop dynamics during vertebrate early embryogenesis
- Other Figures
- All Figure Page
- Back to All Figure Page
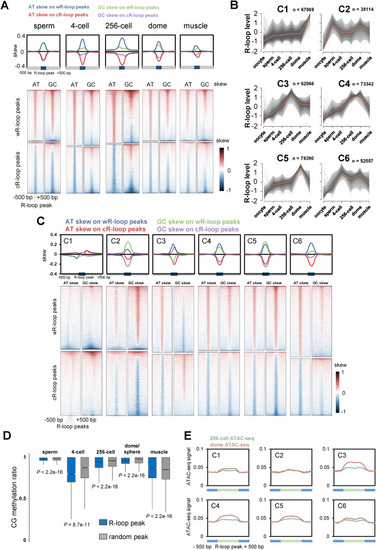
Characteristics of R-loop dynamics during early development. A. Metaplots (upper) and heatmaps (lower) of AT or GC skew around R-loop peaks of sperm, 4-cell, 256-cell, dome and muscle groups. B. Fuzzy cluster analysis of R-loop signals by using Mfuzz. Line plots show ULI-ssDRIP-seq signals, with individual loci (grey lines) and values of the cluster center (orange line). The count of R-loop peaks from each cluster is shown as “n”. R-loop peak locations of each cluster are shown in Table S4. C. Metaplots (upper) and heatmaps (lower) of AT or GC skew around R-loop peaks of clusters 1 to 6 shown in Fig. 4B. D. Box plot of CG methylation levels (SRP020008) on R-loop peaks (blue) or random peaks (grey) in sperm, muscle, and 4-cell, 256-cell, dome/sphere stage embryos. As sphere-stage is very close to dome stage, the CG methylation pattern at sphere stage is analyzed with R-loop peaks at dome stage. P values were calculated using Mann-Whitney U test. E. Metaplots of ATAC-seq signals (GSE101779) around six R-loop clusters (Fig. 4B) in zebrafish embryos at 256-cell or dome stage. |