
- Title
-
scMultiome analysis identifies a single caudal hindbrain compartment in the developing zebrafish nervous system
- Authors
- Warns, J., Kim, Y.I., O'Rourke, R., Sagerström, C.G.
- Source
- Full text @ Neural Dev.
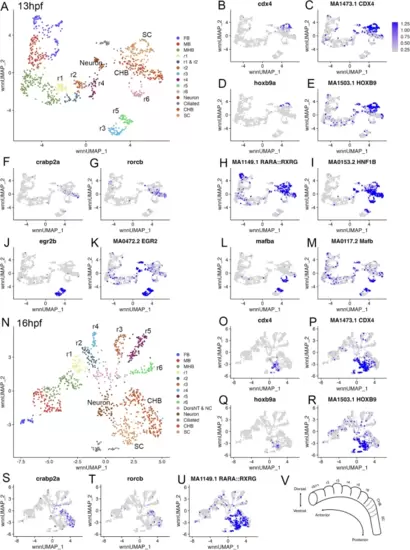
The caudal hindbrain is molecularly resolved at 13hpf and 16hpf in zebrafish. See also Additional file 1, Table S1. (A) UMAP of 13hpf neural clusters. (B-M.) Feature plots showing expressing of the indicated genes (B, D, F, G, J, L), or chromVar activity of the indicated TF motifs (C, E, H, I, K, M). (N) UMAP of 16hpf neural clusters. (O-U.) Feature plots showing expressing of the indicated genes (O, Q, S, T), or chromVar activity of the indicated TF motifs (P, R, U). (V) Schematic of zebrafish hindbrain with embryonic axes indicated. Dashed lines indicate boundaries delineating previously postulated pseudo-rhombomeres. UMAPs in A, N are based on 8.0 and 6.0 res clustering, respectively (chosen because this fully resolves r1-r6). In cases where multiple clusters were assigned the same identity, as was the case for FB, MB, MHB, CHB, and SC, they were combined into a single cluster labeled with that identity. Abbreviations used in all UMAPs: CHB - caudal hindbrain, HB - hindbrain, FB - forebrain, MB - midbrain, MHB - midbrain-hindbrain boundary, NT - neural tube, NC - neural crest, r - rhombomere, SC - spinal cord |
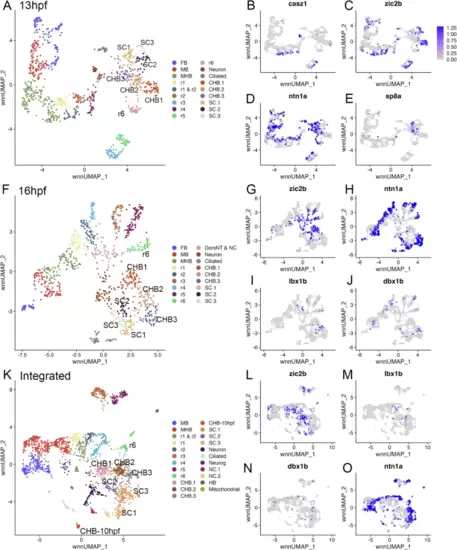
The caudal hindbrain can be subdivided along its dorsoventral axis. See also Additional file 2, Table S2. (A) UMAP of 13hpf neural clusters. (B-E) Feature plots showing expressing of the indicated genes. (F) UMAP of 16hpf neural clusters. (G-J) Feature plots showing expressing of the indicated genes. (K) UMAP of integrated 10hpf, 13hpf and 16hpf neural clusters. (L-O) Feature plots showing expressing of the indicated genes. UMAPs in A, F, K are based on 8.0, 6.0 and 5.0 res clustering, respectively (chosen because this fully resolves r1-r6). In cases where multiple clusters were assigned the same identity, they were combined into a single cluster with that identity – except for CHB and SC clusters that were left separate and labeled consecutively. See legend to Fig. 1 for abbreviations |
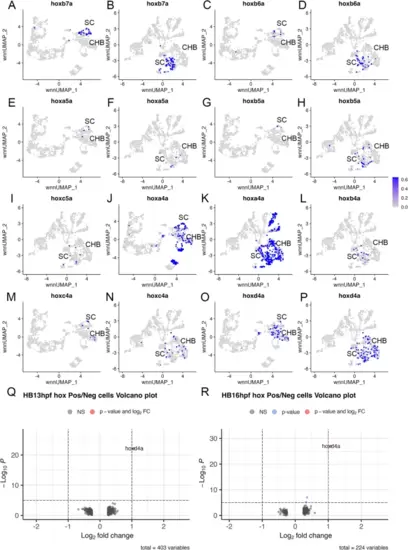
The caudal hindbrain does not contain pseudo-rhombomeres. See also Additional file 3, Table S3. (A-P) Feature plots showing expressing of the indicated hox genes at 13hpf (A, C, E, G, J, M, O) or 16hpf (B, D, F, H, I, K, L, N, P). Q, R. Volcano plots showing genes differentially expressed between PG4 hox-positive and PG4 hox-negative cells at 13hpf (Q) or 16hpf (R). A positive log2FC indicates higher expression in PG4 positive cells. See legend to Fig. 1 for abbreviations |
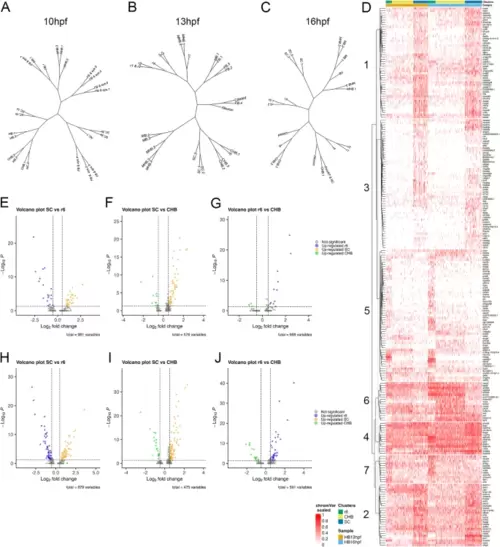
The caudal hindbrain shares gene expression with rhombomere 6 and spinal cord. See also Additional file 6, Table S5 and Additional file 5, Figure S1. A-C. Dendrograms showing relationship between neural clusters at 10hpf (A), 13hpf (B) and 16hpf (C). The clusters used for the dendrograms are based on res 8.0 (10hpf), res 8.0 (13hpf), and res 6.0 (16hpf) – chosen because this fully resolves r1-r6 – with all resulting clusters left separate. (D) Heatmap displaying genes differentially expressed among r6, CHB and SC clustered using Ward D2. (E-J) Volcano plots showing genes differentially expressed in the indicated pairwise comparison among r6, CHB and SC at 13hpf (E-G) or 16hpf (H-J). The cluster definitions for the heatmap and the volcano plots are the same as in Fig. 1A, N. See legend to Fig. 1 for abbreviations |
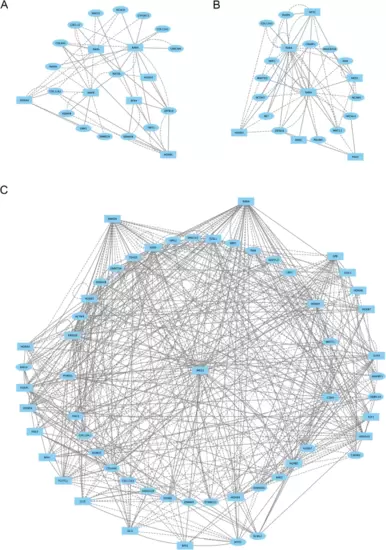
Caudal hindbrain cells display a distinct gene regulatory network at 13hpf. (A-C.) Direct-Net derived gene regulatory networks for r6 (A), CHB (B) and SC (C) at 13hpf. TFs (squares) and non-TFs (ovals) are linked by the presence of accessible TF motifs within 500 bp (solid lines) or 250 kb (dashed lines) of a gene’s transcription start site. Due to the large network produced for SC, only nodes with more than ten connections are shown (the full SC network is shown in Additional file 7, Figure S2B) |
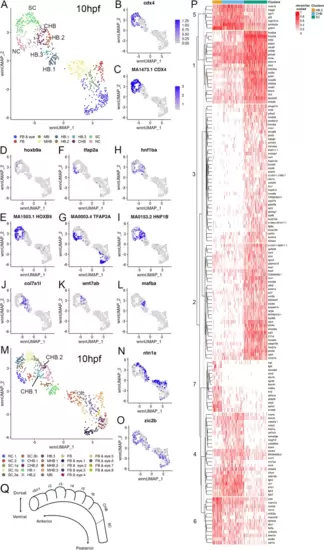
Late gastrula stage caudal hindbrain progenitors are closely related to r6 cells. See also Additional file 8, Table S6 and Additional file 10, Figure S3. (A) UMAP of 10hpf neural clusters. (B-L) Feature plots showing expressing of the indicated genes (B, D, F, H, J, K, L), or chromVar activity of the indicated TF motifs (C, E, G, I). (M) UMAP of 10hpf neural clusters. (N, O) Feature plots showing expressing of the indicated gene. (P) Heatmap displaying genes differentially expressed among HB.2, CHB and SC clustered using Ward D2. (Q) Schematic of zebrafish hindbrain based on scMultiome analysis. Dashed line indicates boundary between CHB and SC. UMAPs in A, M are based on 8.0 res clustering (chosen because this resolves HB.1-HB.3). In A, multiple clusters assigned the same identity were combined into a single cluster labeled with that identity, except for the HB clusters. In M, all clusters were left separate and labeled consecutively. See legend to Fig. 1 for abbreviations |