
|
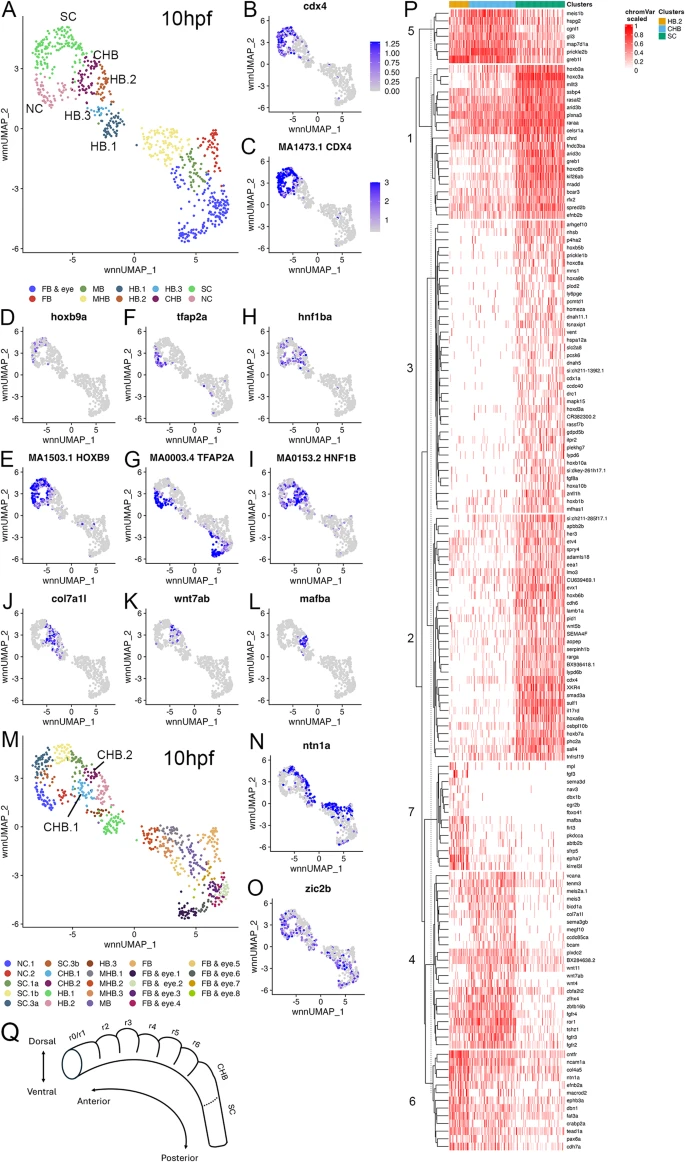
Fig. 6 Late gastrula stage caudal hindbrain progenitors are closely related to r6 cells. See also Additional file 8, Table S6 and Additional file 10, Figure S3. (A) UMAP of 10hpf neural clusters. (B-L) Feature plots showing expressing of the indicated genes (B, D, F, H, J, K, L), or chromVar activity of the indicated TF motifs (C, E, G, I). (M) UMAP of 10hpf neural clusters. (N, O) Feature plots showing expressing of the indicated gene. (P) Heatmap displaying genes differentially expressed among HB.2, CHB and SC clustered using Ward D2. (Q) Schematic of zebrafish hindbrain based on scMultiome analysis. Dashed line indicates boundary between CHB and SC. UMAPs in A, M are based on 8.0 res clustering (chosen because this resolves HB.1-HB.3). In A, multiple clusters assigned the same identity were combined into a single cluster labeled with that identity, except for the HB clusters. In M, all clusters were left separate and labeled consecutively. See legend to Fig. 1 for abbreviations