
Image
|
Figure Caption
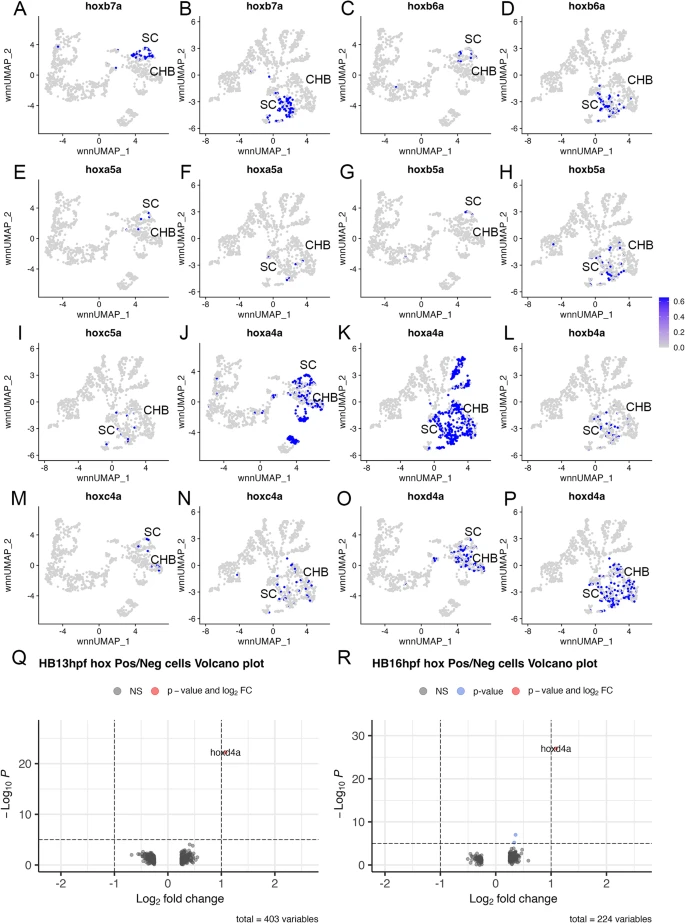
Fig. 3 The caudal hindbrain does not contain pseudo-rhombomeres. See also Additional file 3, Table S3. (A-P) Feature plots showing expressing of the indicated hox genes at 13hpf (A, C, E, G, J, M, O) or 16hpf (B, D, F, H, I, K, L, N, P). Q, R. Volcano plots showing genes differentially expressed between PG4 hox-positive and PG4 hox-negative cells at 13hpf (Q) or 16hpf (R). A positive log2FC indicates higher expression in PG4 positive cells. See legend to Fig. 1 for abbreviations
Acknowledgments
This image is the copyrighted work of the attributed author or publisher, and
ZFIN has permission only to display this image to its users.
Additional permissions should be obtained from the applicable author or publisher of the image.
Full text @ Neural Dev.