
Fig. 4
- ID
- ZDB-FIG-240708-33
- Publication
- Warns et al., 2024 - scMultiome analysis identifies a single caudal hindbrain compartment in the developing zebrafish nervous system
- Other Figures
- All Figure Page
- Back to All Figure Page
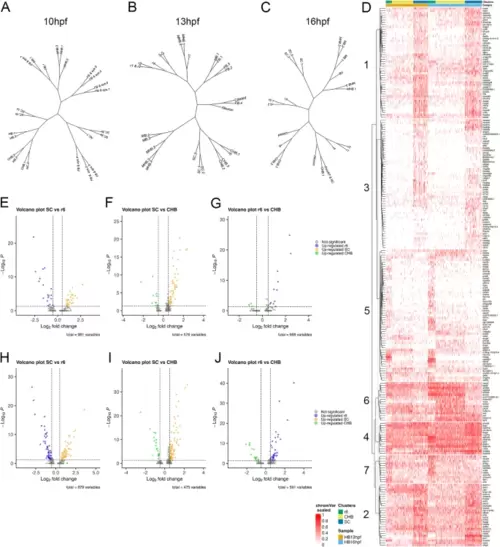
The caudal hindbrain shares gene expression with rhombomere 6 and spinal cord. See also Additional file 6, Table S5 and Additional file 5, Figure S1. A-C. Dendrograms showing relationship between neural clusters at 10hpf (A), 13hpf (B) and 16hpf (C). The clusters used for the dendrograms are based on res 8.0 (10hpf), res 8.0 (13hpf), and res 6.0 (16hpf) – chosen because this fully resolves r1-r6 – with all resulting clusters left separate. (D) Heatmap displaying genes differentially expressed among r6, CHB and SC clustered using Ward D2. (E-J) Volcano plots showing genes differentially expressed in the indicated pairwise comparison among r6, CHB and SC at 13hpf (E-G) or 16hpf (H-J). The cluster definitions for the heatmap and the volcano plots are the same as in Fig. 1A, N. See legend to Fig. 1 for abbreviations |