FIGURE SUMMARY
Title

ErbB3 is required for hyperaminoacidemia-induced pancreatic α cell hyperplasia

Authors
Kang, Q., Jia, J., Dean, E.D., Yuan, H., Dai, C., Li, Z., Jiang, F., Zhang, X.K., Powers, A.C., Chen, W., Li, M.
Source
Full text @ J. Biol. Chem.

Identification the role of ErbB2 and ErbB3 in gcgr deficiency zebrafish.A, schematic of small molecule inhibitor screening using zebrafish reporter line gcgr−/−; Tg (gcga: GFP). B and C, Z-score analysis of the effect on α cell number in 7 dpf larvae by individual compounds from the GSK kinase inhibitor library (B) or Enzo kinase inhibitor library (C), and the red dots indicate hit compounds. D, Venn diagram of the target kinases of the hit compounds from (B and C) indicating ErbB as a strong candidate. E, effect of several other ErbB inhibitors on α cell number in gcgr−/− larvae (n = 6–11), and the cell number was analyzed using one-way ANOVA with a Bonferroni post hoc test. Data are presented as mean ± SD. ∗∗∗∗p < 0.0001. F, schematic of zebrafish α cells isolation from transgenic line Tg(gcga: GFP) by FACS. G, gene expression profile of all erbB members in the zebrafish α cells. Comparison of PCR results from whole fish and α cells is included as a quality control of α cell purity. dpf, days post fertilization; FACS, fluorescence-activated cell sorting; GCGR, glucagon receptor.

Genetic validation of the role for ErbB2 and ErbB3 in gcgr-deficiency zebrafish.A–C, effect of erbB2 and erbB3b knockdown on α cell proliferation. A, quantification of α cell number at 7 dpf in control and gcgr−/− larvae with or without erbB2 and erbB3b knockdown. All fish carry Tg(gcga: GFP) for α cell quantification (n = 11–27), and the cell number was analyzed using two-way ANOVA with a Bonferroni post hoc test. Data are presented as mean ± SD. ∗ p < 0.05 and ∗∗∗∗p < 0.0001. B and C, representative confocal projections (B) and quantification (C) of EdU labeling at 7 dpf in control and gcgr−/− larvae with or without erbB2 and erbB3b knockdown. All fish carry Tg(gcga: GFP) for α cell quantification (n = 8–11) and the cell number was analyzed using unpaired two-tailed t test. Data are presented as mean ± SD, ∗ p < 0.05. The scale bar represents 10 μm. D, schematic of the Tg(gcga: CD533, LC) transgene used to express a dominant-negative ERBB1 in α cells under the control of zebrafish glucagon promoter. The linked α crystallin promoter: mCerulean is used for genotyping. EG, effect of CD533 on the α cell proliferation. E, quantification of the α cell number at 7 dpf in control and gcgr−/− larvae with or without Tg(gcga: CD533) (n = 15–48), the cell number was analyzed using two-way ANOVA with a Bonferroni post hoc test. Data are presented as mean ± SD. ∗ p < 0.05 and ∗∗∗∗p < 0.0001. F and G, representative confocal projections (F) and quantification (G) of EdU labeling at 7 dpf in control and gcgr−/− larvae with or without Tg(gcga: CD533, LC) (n = 10–12), and the cell number was analyzed using unpaired two-tailed t test. Data are presented as mean ± SD, ∗∗∗ p < 0.001. Arrows indicate EdU and GFP double positive cells. The scale bar represents 10 μm. dpf, days post fertilization; EdU, 5-ethynyl-2-deoxyuridine; GCGR, glucagon receptor.

ErbB3 activated in Gcgr−/−mouse α cells.A and B, the ErbBs expression levels (A) and distribution (B) in WT versus Gcgr−/− mouse α cells shown by heatmap and t-distributed stochastic neighbor embedding plots. Data was analyzed based on the single-cell sequencing data from our lab (GSE253271). Scale ranges correspond to the gene expression as indicated. C and D, representative images of p-ErbB3 (C) and quantification (D) of immunofluorescence in pancreatic islets from WT and Gcgr−/− mice. Arrowheads point to representative p-ErbB3–positive α cells. n = 7 to 11. The p-ErbB3–positive α cells ratio was analyzed using unpaired two-tailed t test. Data are presented as mean ± SD. ∗∗∗p < 0.001. GCGR, glucagon receptor.

ErbB3 is essential for Gcgr−/−mouse serum or high amino acid stimulated α cell proliferation.A, schematic for ex vivo islet culture with mouse serum or high amino acids stimulation and α cell proliferation quantification assay. B and C, representative immunofluorescence images (B) and quantification (C) of islets cultured medium with WT and Gcgr−/− serum. Arrowheads point to representative p-ErbB3–positive α cells (n = 6), and p-ErbB3–positive α cells ratio was analyzed using the unpaired two-tailed t test. Data are presented as mean ± SD, ∗p < 0.05. D and E, representative immunofluorescence images (D) and quantification (E) of islets transduced with sh-ErbB3 or control adenovirus and cultured in medium with WT or Gcgr−/− serum (n = 6–9). Arrowheads point to representative proliferating α cells (Ki67 and glucagon double positive), and the Ki67-positive α cells ratio was analyzed using two-way ANOVA with a Bonferroni post hoc test. Data are presented as mean ± SD. ∗∗ p < 0.01 and ∗∗∗p < 0.001. F and G, representative immunofluorescence images (F) and quantification (G) of islets cultured in the control medium or medium supplemented with glutamine and alanine. White arrowheads indicate representative p-ErbB3–positive α cells (n = 4–9), the p-ErbB3–positive α cells ratio was analyzed using the unpaired two-tailed t test. Data are presented as mean ± SD, ∗∗p < 0.01. H and I, representative immunofluorescence images (H) and quantification (I) of islets transduced by sh-ErbB3 or control adenovirus and cultured in control medium or medium supplemented with glutamine and alanine, and white arrowheads indicate representative Ki67-positive α cells (n = 5–9). The Ki67-positive α cells ratio was analyzed using two-way ANOVA with a Bonferroni post hoc test. Data are presented as mean ± SD. ∗∗∗∗p < 0.0001. GCGR, glucagon receptor.

ErbB3 is essential for high amino acid stimulated αTC1-6 proliferation and involved in mTOR activation.A, relative αTC1-6 cell number after 5 days in control medium and medium supplemented with alanine, glutamine, or both (n = 3), the relative cell number was analyzed using one-way ANOVA with a Bonferroni post hoc test. Data are presented as mean ± SD. ∗∗∗∗p < 0.0001. BD, the representative image (B) and quantification (C and D) of relative ErbB3/GAPDH and p-ErbB3/ErbB3 levels in αTC1-6 after high amino acids treatment, and the relative protein level was analyzed using one-way ANOVA with a Bonferroni post hoc test. Data are presented as mean ± SD. ∗p < 0.05 and ∗∗p < 0.01. E, Western blot analysis of ErbB3 in WT and ErbB3 KO αTC1-6 cells. F, growth curve of WT (solid lines) and ErbB3 KO (dashed lines) αTC1-6 cells in control or high amino acids medium, and the relative cell number was analyzed using two-way ANOVA with a Bonferroni post hoc test. Data are presented as mean ± SD. ∗∗∗∗p < 0.0001. G–I, the representative images (G) and quantification (H and I) of total mTOR/GAPDH and p-mTOR/mTOR levels in WT and ErbB3 KO αTC1-6 cells cultured in control or high amino acids medium. The black arrowhead indicates the relevant bands, and the relative protein level was analyzed using one-way ANOVA with a Bonferroni post hoc test. Data are presented as mean ± SD. ∗p < 0.05 and ∗∗p < 0.01. J and K, representative immunofluorescence images (J) and quantification (K) of islets transduced with sh-ErbB3 or control adenovirus and cultured in the control medium or medium supplemented with glutamine and alanine. White arrowheads indicate representative p-S6–positive α cells (n = 4–8), and the p-S6–positive α cell ratio was analyzed using two-way ANOVA with a Bonferroni post hoc test. Data are presented as mean ± SD. ∗∗∗∗p < 0.0001.

STAT3 plays an important role in high amino acid induced α cell proliferation.AC, representative images (A) and quantification (B and C) of total STAT3/α-tubulin and p-STAT3/STAT3 levels in WT and ErbB3 KO αTC1-6 cells cultured in control or high amino acids medium, the relative protein level was analyzed using one-way ANOVA with a Bonferroni post hoc test. Data are presented as mean ± SD. ∗∗p < 0.01 and ∗∗∗∗p < 0.0001. D and E, representative immunofluorescence images (D) and quantification (E) of islets transduced by sh-ErbB3 or control adenovirus and cultured in control or glutamine plus alanine contained medium, white arrowheads indicate representative p-STAT3–positive α cells (n = 3–7), and the p-STAT3–positive α cells ratio was analyzed using two-way ANOVA with a Bonferroni post hoc test. Data are presented as mean ± SD. ∗∗p < 0.01. F and G, representative immunofluorescence images of p-STAT3 (F) and quantification (G) of the percentage of p-STAT3–positive α cells in pancreatic islets of WT and Gcgr−/− mice (n = 8–15), and the p-STAT3–positive α cell ratio was analyzed using unpaired two-tailed t test. Data are presented as mean ± SD. ∗∗∗∗p < 0.0001. H and I, representative immunofluorescence images (H) and quantification (I) of islets cultured in the control medium or medium supplemented with glutamine and alanine in the presence of 1 μM Stattic or vehicle (n = 7–11), the Ki67-positive α cells ratio was analyzed using two-way ANOVA with a Bonferroni post hoc test. Data are presented as mean ± SD. ∗∗∗∗p < 0.0001. White arrowheads indicate representative Ki67-positive α cells. J and K, representative single optical section of islet immunofluorescence images (J) and quantification (K) of islets cultured in control medium or medium supplemented with glutamine and alanine in the presence of 30 nM rapamycin or vehicle (n = 6–10). White arrowheads indicate representative p-STAT3–positive α cells. The p-STAT3–positive α cells ratio was analyzed using two-way ANOVA with a Bonferroni post hoc test. Data are presented as mean ± SD. ∗ p < 0.05, ∗∗∗∗p < 0.0001. GCGR, glucagon receptor; STAT3, signal transducer and activator of transcription 3.

A high amino acid medium activates cyclin D2 and suppresses p27 via ErbB3 to promote cell cycle.A, Western blot analysis of selected cell cycle regulators in WT αTC1-6 cells cultured in control medium or medium with high amino acids for 2-h increments. B, Western blot analysis of selected cell cycle regulators in Erbb3 KO cultured in control medium or medium with high amino acids for 2-h increments. C–F, the representative images (C) and quantification of cyclin D2 (D), CDK6 (E), and p27 (F) levels in WT αTC1-6 cells cultured in the control medium or medium with high amino acids for 24 h in the presence or absence of 30 nM rapamycin and/or 1 μM Stattic. n = 3, and the relative protein level was analyzed using one-way ANOVA with a Bonferroni post hoc test. Data are presented as mean ± SD. ∗ p < 0.05, ∗∗p < 0.01, ∗∗∗p < 0.001, and ∗∗∗∗p < 0.0001. G–I, violin and t-distributed stochastic neighbor embedding plots showed the expression level and distribution of cyclin D2 (G), CDK6 (H), and p27 (I) in WT and Gcgr−/− mouse α cells from our single-cell RNA-seq (GSE253271). CDK, cyclin dependent kinase; GCGR, glucagon receptor.

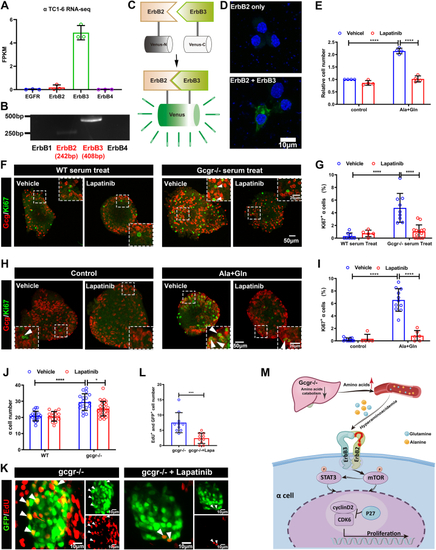
The ErbB2 forms heterodimer with ErbB3 involved in α cell proliferation. A, the ErbBs expression level in αTC1-6 cell line from published αTC1-6 RNA-seq data (GSE112511). B, the RT-PCR analysis of ErbBs family members expression in αTC1-6 cell. C, schema of bimolecular fluorescent complimentary (BiFC) assay for ErbB2 and ErbB3 heterodimer. The ErbB2 carries Venus N-terminal fragment and the ErbB3 carries Venus C-terminal fragment, the formation of ErbB2 and ErbB3 heterodimer leads to Venus N-terminal couple with Venus C-terminal, and shine the fluorescence of Venus finally. D, the representative images of Venus fluorescence caused by ErbB2 and ErbB3 heterodimer formation in αTC1-6, the cell only transfected with ErbB2-Venus-N as the negative control, and the scale bar represents 10 μm. E, the relative cell growth of αTC1-6 cultured in the control medium or medium supplemented with glutamine and alanine in the presence of lapatinib (5 μM) or vehicle (n = 4), and the relative cell number was analyzed using two-way ANOVA with a Bonferroni post hoc test. Data are presented as mean ± SD. ∗∗∗∗p < 0.0001. F and G, representative immunofluorescence images (F) and quantification (G) of islets incubated in a medium containing WT or Gcgr−/− serum in the presence of lapatinib (5 μM) or vehicle (n = 5–13), the Ki67-positive α cell ratio was analyzed using two-way ANOVA with a Bonferroni post hoc test. Data are presented as mean ± SD. ∗∗∗∗p < 0.0001. H and I, representative immunofluorescence images (H) and quantification (I) of islets cultured in control or 4 mM glutamine and alanine contained medium in the presence of lapatinib (5 μM) or vehicle, glucagon (red) and Ki67 (green) are shown. n = 5 to 11, and the Ki67-positive α cell ratio was analyzed using two-way ANOVA with a Bonferroni post hoc test. Data are presented as mean ± SD. ∗∗∗∗p < 0.0001. J, quantification of α cell number in WT and gcgr−/−; Tg(gcga: GFP) was treated with vehicle (dimethyl sulfoxide) or lapatinib, respectively, n = 15 to 26, and the α cell number was analyzed using two-way ANOVA with a Bonferroni post hoc test. Data are presented as mean ± SD. ∗p < 0.05 and ∗∗∗∗p < 0.0001. K and L, the representative islet images (K) and quantification (L) of EdU-positive α cells in gcgr−/−; Tg(gcga: GFP) treated with or without lapatinib. α cells were shown as green, and EdU were shown as red. Arrows indicate double positive cells. The scale bar represents 10 μm. The α cell number was analyzed using the unpaired two-tailed t test (n = 10). Data are presented as mean ± SD. ∗∗∗p < 0.001. M, working model of hyperaminoacidemia-induced α cell hyperplasia through ErbB2/ErbB3 heterodimer. Elevated serum amino acid levels indirectly activate ErbB3 and its partner, triggering the downstream mechanistic target of rapamycin complex 1 and signal transducer and activator of transcription 3 signalings, which regulate cell cycle regulators to promote α cell proliferation. dpf, days post fertilization; EdU, 5-ethynyl-2-deoxyuridine; GCGR, glucagon receptor.

Acknowledgments
This image is the copyrighted work of the attributed author or publisher, and ZFIN has permission only to display this image to its users. Additional permissions should be obtained from the applicable author or publisher of the image. Full text @ J. Biol. Chem.