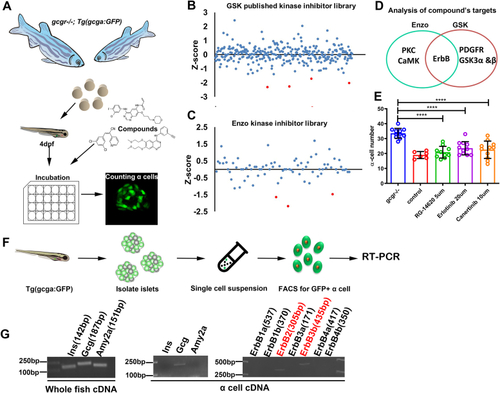
Identification the role of ErbB2 and ErbB3 in gcgr deficiency zebrafish.A, schematic of small molecule inhibitor screening using zebrafish reporter line gcgr−/−; Tg (gcga: GFP). B and C, Z-score analysis of the effect on α cell number in 7 dpf larvae by individual compounds from the GSK kinase inhibitor library (B) or Enzo kinase inhibitor library (C), and the red dots indicate hit compounds. D, Venn diagram of the target kinases of the hit compounds from (B and C) indicating ErbB as a strong candidate. E, effect of several other ErbB inhibitors on α cell number in gcgr−/− larvae (n = 6–11), and the cell number was analyzed using one-way ANOVA with a Bonferroni post hoc test. Data are presented as mean ± SD. ∗∗∗∗p < 0.0001. F, schematic of zebrafish α cells isolation from transgenic line Tg(gcga: GFP) by FACS. G, gene expression profile of all erbB members in the zebrafish α cells. Comparison of PCR results from whole fish and α cells is included as a quality control of α cell purity. dpf, days post fertilization; FACS, fluorescence-activated cell sorting; GCGR, glucagon receptor.
|
