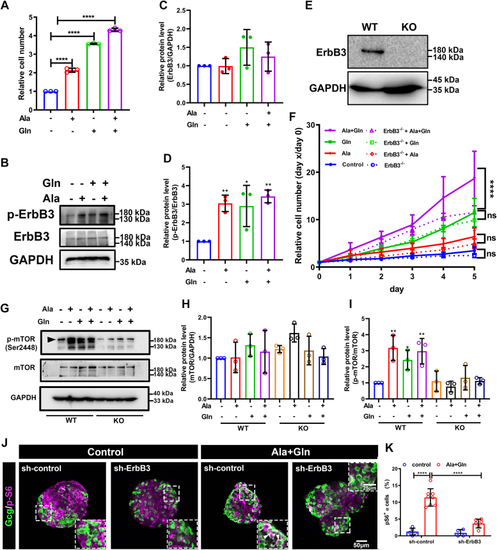
ErbB3 is essential for high amino acid stimulated αTC1-6 proliferation and involved in mTOR activation.A, relative αTC1-6 cell number after 5 days in control medium and medium supplemented with alanine, glutamine, or both (n = 3), the relative cell number was analyzed using one-way ANOVA with a Bonferroni post hoc test. Data are presented as mean ± SD. ∗∗∗∗p < 0.0001. B–D, the representative image (B) and quantification (C and D) of relative ErbB3/GAPDH and p-ErbB3/ErbB3 levels in αTC1-6 after high amino acids treatment, and the relative protein level was analyzed using one-way ANOVA with a Bonferroni post hoc test. Data are presented as mean ± SD. ∗p < 0.05 and ∗∗p < 0.01. E, Western blot analysis of ErbB3 in WT and ErbB3 KO αTC1-6 cells. F, growth curve of WT (solid lines) and ErbB3 KO (dashed lines) αTC1-6 cells in control or high amino acids medium, and the relative cell number was analyzed using two-way ANOVA with a Bonferroni post hoc test. Data are presented as mean ± SD. ∗∗∗∗p < 0.0001. G–I, the representative images (G) and quantification (H and I) of total mTOR/GAPDH and p-mTOR/mTOR levels in WT and ErbB3 KO αTC1-6 cells cultured in control or high amino acids medium. The black arrowhead indicates the relevant bands, and the relative protein level was analyzed using one-way ANOVA with a Bonferroni post hoc test. Data are presented as mean ± SD. ∗p < 0.05 and ∗∗p < 0.01. J and K, representative immunofluorescence images (J) and quantification (K) of islets transduced with sh-ErbB3 or control adenovirus and cultured in the control medium or medium supplemented with glutamine and alanine. White arrowheads indicate representative p-S6–positive α cells (n = 4–8), and the p-S6–positive α cell ratio was analyzed using two-way ANOVA with a Bonferroni post hoc test. Data are presented as mean ± SD. ∗∗∗∗p < 0.0001.
|
