|
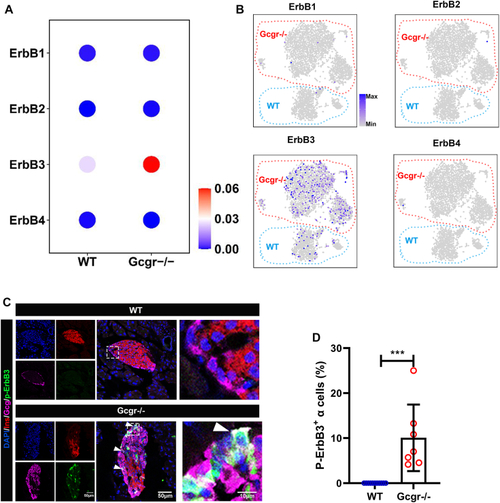
ErbB3 activated in Gcgr−/−mouse α cells.A and B, the ErbBs expression levels (A) and distribution (B) in WT versus Gcgr−/− mouse α cells shown by heatmap and t-distributed stochastic neighbor embedding plots. Data was analyzed based on the single-cell sequencing data from our lab (GSE253271). Scale ranges correspond to the gene expression as indicated. C and D, representative images of p-ErbB3 (C) and quantification (D) of immunofluorescence in pancreatic islets from WT and Gcgr−/− mice. Arrowheads point to representative p-ErbB3–positive α cells. n = 7 to 11. The p-ErbB3–positive α cells ratio was analyzed using unpaired two-tailed t test. Data are presented as mean ± SD. ∗∗∗p < 0.001. GCGR, glucagon receptor.
|