
Figure 6
- ID
- ZDB-IMAGE-240819-9
- Publication
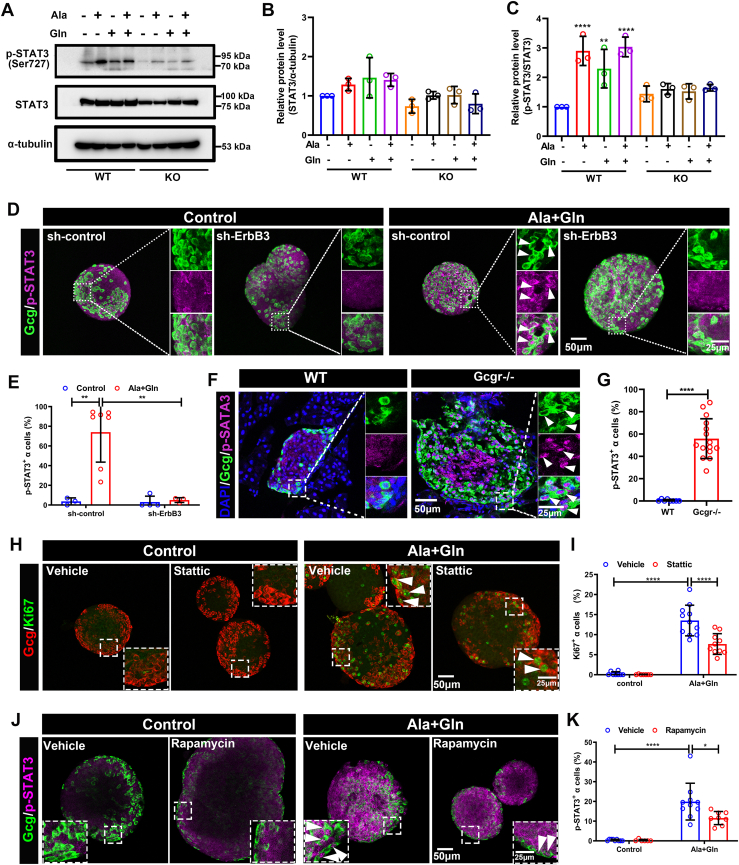
- Kang et al., 2024 - ErbB3 is required for hyperaminoacidemia-induced pancreatic α cell hyperplasia
- All Figures
- Figures for Kang et al., 2024
|
Figure 6