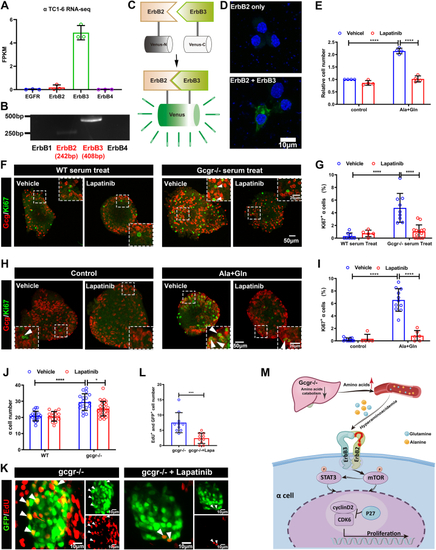
The ErbB2 forms heterodimer with ErbB3 involved in α cell proliferation. A, the ErbBs expression level in αTC1-6 cell line from published αTC1-6 RNA-seq data (GSE112511). B, the RT-PCR analysis of ErbBs family members expression in αTC1-6 cell. C, schema of bimolecular fluorescent complimentary (BiFC) assay for ErbB2 and ErbB3 heterodimer. The ErbB2 carries Venus N-terminal fragment and the ErbB3 carries Venus C-terminal fragment, the formation of ErbB2 and ErbB3 heterodimer leads to Venus N-terminal couple with Venus C-terminal, and shine the fluorescence of Venus finally. D, the representative images of Venus fluorescence caused by ErbB2 and ErbB3 heterodimer formation in αTC1-6, the cell only transfected with ErbB2-Venus-N as the negative control, and the scale bar represents 10 μm. E, the relative cell growth of αTC1-6 cultured in the control medium or medium supplemented with glutamine and alanine in the presence of lapatinib (5 μM) or vehicle (n = 4), and the relative cell number was analyzed using two-way ANOVA with a Bonferroni post hoc test. Data are presented as mean ± SD. ∗∗∗∗p < 0.0001. F and G, representative immunofluorescence images (F) and quantification (G) of islets incubated in a medium containing WT or Gcgr−/− serum in the presence of lapatinib (5 μM) or vehicle (n = 5–13), the Ki67-positive α cell ratio was analyzed using two-way ANOVA with a Bonferroni post hoc test. Data are presented as mean ± SD. ∗∗∗∗p < 0.0001. H and I, representative immunofluorescence images (H) and quantification (I) of islets cultured in control or 4 mM glutamine and alanine contained medium in the presence of lapatinib (5 μM) or vehicle, glucagon (red) and Ki67 (green) are shown. n = 5 to 11, and the Ki67-positive α cell ratio was analyzed using two-way ANOVA with a Bonferroni post hoc test. Data are presented as mean ± SD. ∗∗∗∗p < 0.0001. J, quantification of α cell number in WT and gcgr−/−; Tg(gcga: GFP) was treated with vehicle (dimethyl sulfoxide) or lapatinib, respectively, n = 15 to 26, and the α cell number was analyzed using two-way ANOVA with a Bonferroni post hoc test. Data are presented as mean ± SD. ∗p < 0.05 and ∗∗∗∗p < 0.0001. K and L, the representative islet images (K) and quantification (L) of EdU-positive α cells in gcgr−/−; Tg(gcga: GFP) treated with or without lapatinib. α cells were shown as green, and EdU were shown as red. Arrows indicate double positive cells. The scale bar represents 10 μm. The α cell number was analyzed using the unpaired two-tailed t test (n = 10). Data are presented as mean ± SD. ∗∗∗p < 0.001. M, working model of hyperaminoacidemia-induced α cell hyperplasia through ErbB2/ErbB3 heterodimer. Elevated serum amino acid levels indirectly activate ErbB3 and its partner, triggering the downstream mechanistic target of rapamycin complex 1 and signal transducer and activator of transcription 3 signalings, which regulate cell cycle regulators to promote α cell proliferation. dpf, days post fertilization; EdU, 5-ethynyl-2-deoxyuridine; GCGR, glucagon receptor.
|