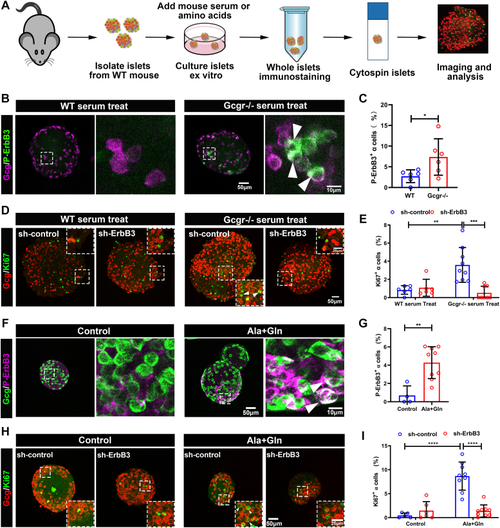
ErbB3 is essential for Gcgr−/−mouse serum or high amino acid stimulated α cell proliferation.A, schematic for ex vivo islet culture with mouse serum or high amino acids stimulation and α cell proliferation quantification assay. B and C, representative immunofluorescence images (B) and quantification (C) of islets cultured medium with WT and Gcgr−/− serum. Arrowheads point to representative p-ErbB3–positive α cells (n = 6), and p-ErbB3–positive α cells ratio was analyzed using the unpaired two-tailed t test. Data are presented as mean ± SD, ∗p < 0.05. D and E, representative immunofluorescence images (D) and quantification (E) of islets transduced with sh-ErbB3 or control adenovirus and cultured in medium with WT or Gcgr−/− serum (n = 6–9). Arrowheads point to representative proliferating α cells (Ki67 and glucagon double positive), and the Ki67-positive α cells ratio was analyzed using two-way ANOVA with a Bonferroni post hoc test. Data are presented as mean ± SD. ∗∗ p < 0.01 and ∗∗∗p < 0.001. F and G, representative immunofluorescence images (F) and quantification (G) of islets cultured in the control medium or medium supplemented with glutamine and alanine. White arrowheads indicate representative p-ErbB3–positive α cells (n = 4–9), the p-ErbB3–positive α cells ratio was analyzed using the unpaired two-tailed t test. Data are presented as mean ± SD, ∗∗p < 0.01. H and I, representative immunofluorescence images (H) and quantification (I) of islets transduced by sh-ErbB3 or control adenovirus and cultured in control medium or medium supplemented with glutamine and alanine, and white arrowheads indicate representative Ki67-positive α cells (n = 5–9). The Ki67-positive α cells ratio was analyzed using two-way ANOVA with a Bonferroni post hoc test. Data are presented as mean ± SD. ∗∗∗∗p < 0.0001. GCGR, glucagon receptor.
|
