
- Title
-
Accelerated evolution in the human lineage led to gain and loss of transcriptional enhancers in the RBFOX1 locus
- Authors
- Berasain, L., Beati, P., Trigila, A.P., Rubinstein, M., Franchini, L.F.
- Source
- Full text @ Sci Adv

Genomic location of RBFOX1-HARs. (A) RBFOX1 locus showing the position of HARs on chromosome 16 of the human genome. The genomic region is divided into two TADs as established using human fetal cortical plate (25) and other tissues (fig. S1) (26). (B) Absolute number of HARs per transcriptional unit in genes larger than 800 kb. (C) Frequency of HARs/Mb normalized to the length of the transcriptional unit. The dotted line represents the 90th percentile (P90); all values above are within the top 10% of HARs/Mb. |
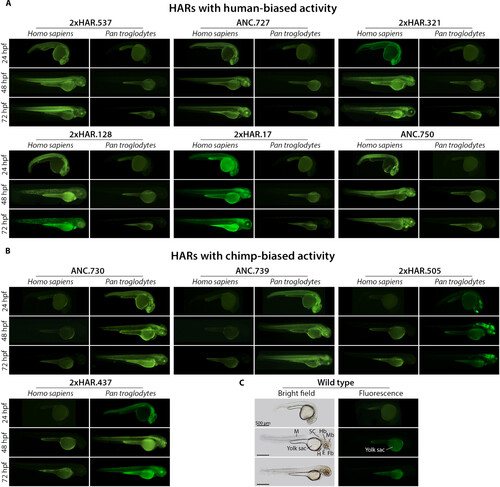
Comparative expression assays in transgenic zebrafish. RBFOX1-HARs with (A) human-biased and (B) chimp-biased activity. A representative image of the expression pattern driven by the human sequence (Homo sapiens) and its chimpanzee ortholog (Pan troglodytes) is shown at 24, 48, and 72 hpf. (C) Bright-field and fluorescent reference images of wild-type zebrafish. Note that the yolk sac of zebrafish emits autofluorescence. Fb, forebrain; Mb, midbrain; Hb, hindbrain; SC, spinal cord; E, eye; H, heart; M, muscle. All transgenic lines analyzed are included in fig. S3, and higher-magnification images are shown in fig. S4. |
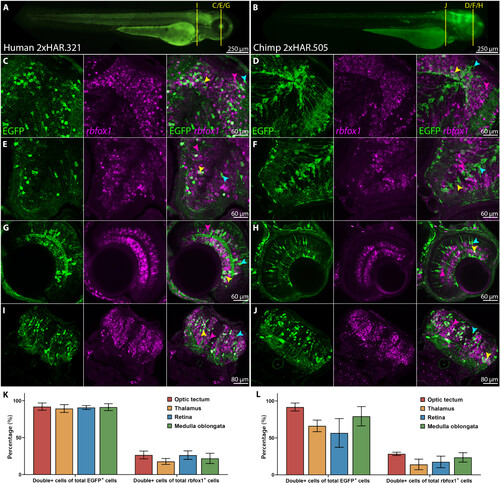
2xHAR.321 and 2xHAR.505 drive expression to rbfox1 cells in zebrafish. Representative transgenic zebrafish expressing EGFP under the control of (A) 2xHAR.321 human sequence and (B) 2xHAR.505 chimpanzee sequence at 72 hpf. Yellow bars indicate the approximate location of the coronal cryosections. (C to J) Confocal microscopy images of cryosections showing EGFP and rbfox1 expression on the [(C) and (D)] optic tectum, [(E) and (F)] thalamus, [(G) and (H)] retina, and [(I) and (J)] medulla oblongata. (K and L) Quantification of double-positive cells of total EGFP-positive or rbfox1-positive cells for (K) 2xHAR.321 and (L) 2xHAR.505. Arrows indicate examples of double-expressing cells (yellow), rbfox1-expressing cells (pink), and EGFP-expressing cells (light blue). |
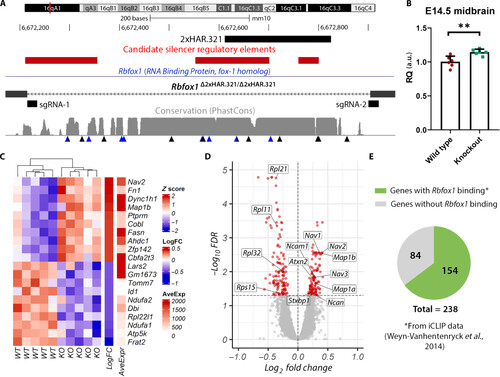
Gene expression analysis in Rbfox1Δ2xHAR.321/Δ2xHAR.321 mice. (A) Generation of 2xHAR.321 knockout mice. Two sgRNAs were designed at the ends of the target sequence, and the result was confirmed by sequencing. Candidate silencer regulatory elements lifted over from the human genome are included (40). Below the level of sequence conservation, arrows indicate the presence of substitutions; black arrows are human-specific substitutions, and blue arrows are chimpanzee-specific substitutions. (B) Rbfox1 relative expression in the midbrain at E14.5. Expression quantification was performed using the 2−ΔΔCt method with Actb as the reference gene, and the comparison between wild-type (Rbfox1+/+; wild type) and Rbfox1Δ2xHAR.321/Δ2xHAR.321 mice (knockout) was performed using the Student’s t test (n = 6; P = 0.0040). a.u., arbitrary unit. (C) Heatmap of top up-regulated and down-regulated genes. Each row represents a gene, and each column represents a sample. (D) Volcano plot showing the statistical significance (−log10FDR) versus the magnitude of change (log2FC) of the DEGs. (E) Proportion of DEGs with evidence of Rbfox1 direct binding as identified by iCLIP experiments from whole mouse brain (43). |
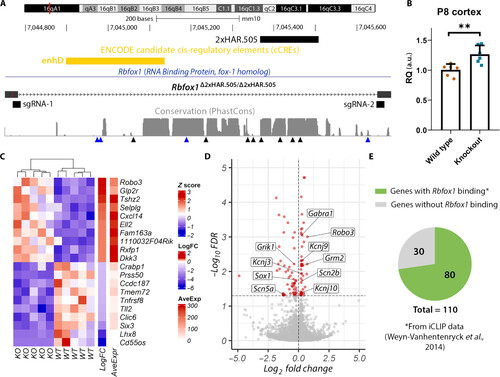
Gene expression analysis in Rbfox1Δ2xHAR.505/Δ2xHAR.505 mice. (A) Generation of 2xHAR.505 knockout mice. Two sgRNAs were designed at the ends of the target sequence, and the result was confirmed by sequencing. Candidate cis-regulatory elements from ENCODE are included (76). Below the level of sequence conservation, arrows indicate the presence of substitutions; black arrows indicate human-specific substitutions, and blue arrows point to chimpanzee-specific substitutions. (B) Rbfox1 relative expression in the cerebral cortex at P8 is shown. Expression quantification was performed using the 2−ΔΔCt method with Actb as the reference gene, and the comparison between wild-type (wild type) and Rbfox1Δ2xHAR.505/Δ2xHAR.505 mice (knockout) was performed using the Student’s t test (n = 6; P = 0.0052). (C) Heatmap of top up-regulated and down-regulated genes. Each row represents a gene, and each column represents a sample. (D) Volcano plot showing the statistical significance (−log10FDR) versus the magnitude of change (log2FC) of the DEGs. (E) Proportion of DEGs with evidence of Rbfox1 direct binding as identified by iCLIP experiments from whole mouse brain (43). |
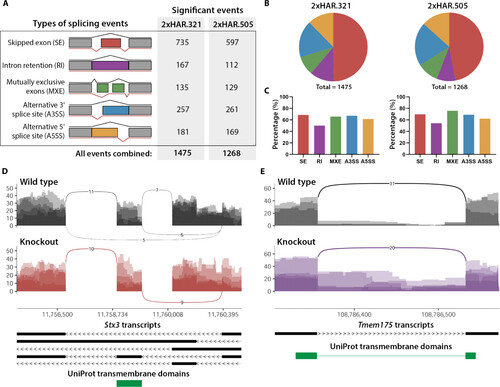
AS is altered in Rbfox1Δ2xHAR.321/Δ2xHAR.321 and Rbfox1Δ2xHAR.505/Δ2xHAR.505 mutant mice. (A) Types of AS events and the number of statistically significant events (FDR < 0.05; ΔPSI > 0.1) found in 2xHAR.321 and 2xHAR.505 knockout mice. (B) Pie chart showing the breakdown of AS events. (C) Proportion of differentially spliced genes with evidence of Rbfox1 direct binding as identified by iCLIP experiments from whole mouse brain at P15 (43). (D and E) Sashimi plots of selected examples of (D) exon skipping (Stx3) and (E) RI (Tmem175) in the Rbfox1Δ2xHAR.321/Δ2xHAR.321 mutant versus wild-type mice. Sashimi plots show the density of reads for each alternative exon or intron depicted below for each gene transcript. Arcs in the plots represent splice junctions that connect exons, and the number on each arc is the junction depth (number of junction reads). Important protein domains from UniProt are shown below the gene transcripts. Validation experiments for Stx3 and Tmem175 are included in fig. S10. |