
Fig. 5
- ID
- ZDB-FIG-240627-54
- Publication
- Berasain et al., 2024 - Accelerated evolution in the human lineage led to gain and loss of transcriptional enhancers in the RBFOX1 locus
- Other Figures
- All Figure Page
- Back to All Figure Page
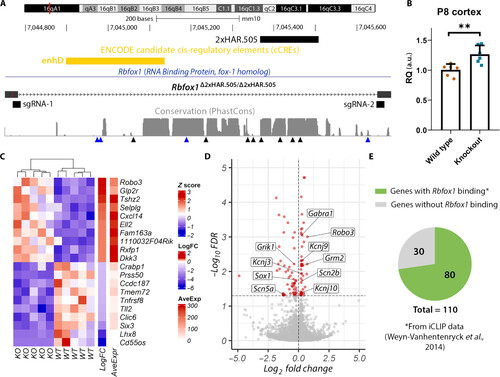
Gene expression analysis in Rbfox1Δ2xHAR.505/Δ2xHAR.505 mice. (A) Generation of 2xHAR.505 knockout mice. Two sgRNAs were designed at the ends of the target sequence, and the result was confirmed by sequencing. Candidate cis-regulatory elements from ENCODE are included (76). Below the level of sequence conservation, arrows indicate the presence of substitutions; black arrows indicate human-specific substitutions, and blue arrows point to chimpanzee-specific substitutions. (B) Rbfox1 relative expression in the cerebral cortex at P8 is shown. Expression quantification was performed using the 2−ΔΔCt method with Actb as the reference gene, and the comparison between wild-type (wild type) and Rbfox1Δ2xHAR.505/Δ2xHAR.505 mice (knockout) was performed using the Student’s t test (n = 6; P = 0.0052). (C) Heatmap of top up-regulated and down-regulated genes. Each row represents a gene, and each column represents a sample. (D) Volcano plot showing the statistical significance (−log10FDR) versus the magnitude of change (log2FC) of the DEGs. (E) Proportion of DEGs with evidence of Rbfox1 direct binding as identified by iCLIP experiments from whole mouse brain (43). |