
Fig. 4
- ID
- ZDB-FIG-240627-53
- Publication
- Berasain et al., 2024 - Accelerated evolution in the human lineage led to gain and loss of transcriptional enhancers in the RBFOX1 locus
- Other Figures
- All Figure Page
- Back to All Figure Page
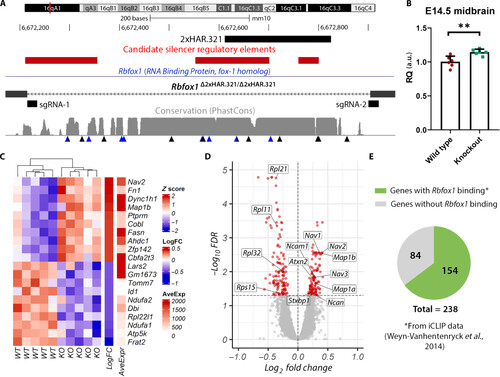
Gene expression analysis in Rbfox1Δ2xHAR.321/Δ2xHAR.321 mice. (A) Generation of 2xHAR.321 knockout mice. Two sgRNAs were designed at the ends of the target sequence, and the result was confirmed by sequencing. Candidate silencer regulatory elements lifted over from the human genome are included (40). Below the level of sequence conservation, arrows indicate the presence of substitutions; black arrows are human-specific substitutions, and blue arrows are chimpanzee-specific substitutions. (B) Rbfox1 relative expression in the midbrain at E14.5. Expression quantification was performed using the 2−ΔΔCt method with Actb as the reference gene, and the comparison between wild-type (Rbfox1+/+; wild type) and Rbfox1Δ2xHAR.321/Δ2xHAR.321 mice (knockout) was performed using the Student’s t test (n = 6; P = 0.0040). a.u., arbitrary unit. (C) Heatmap of top up-regulated and down-regulated genes. Each row represents a gene, and each column represents a sample. (D) Volcano plot showing the statistical significance (−log10FDR) versus the magnitude of change (log2FC) of the DEGs. (E) Proportion of DEGs with evidence of Rbfox1 direct binding as identified by iCLIP experiments from whole mouse brain (43). |