
|
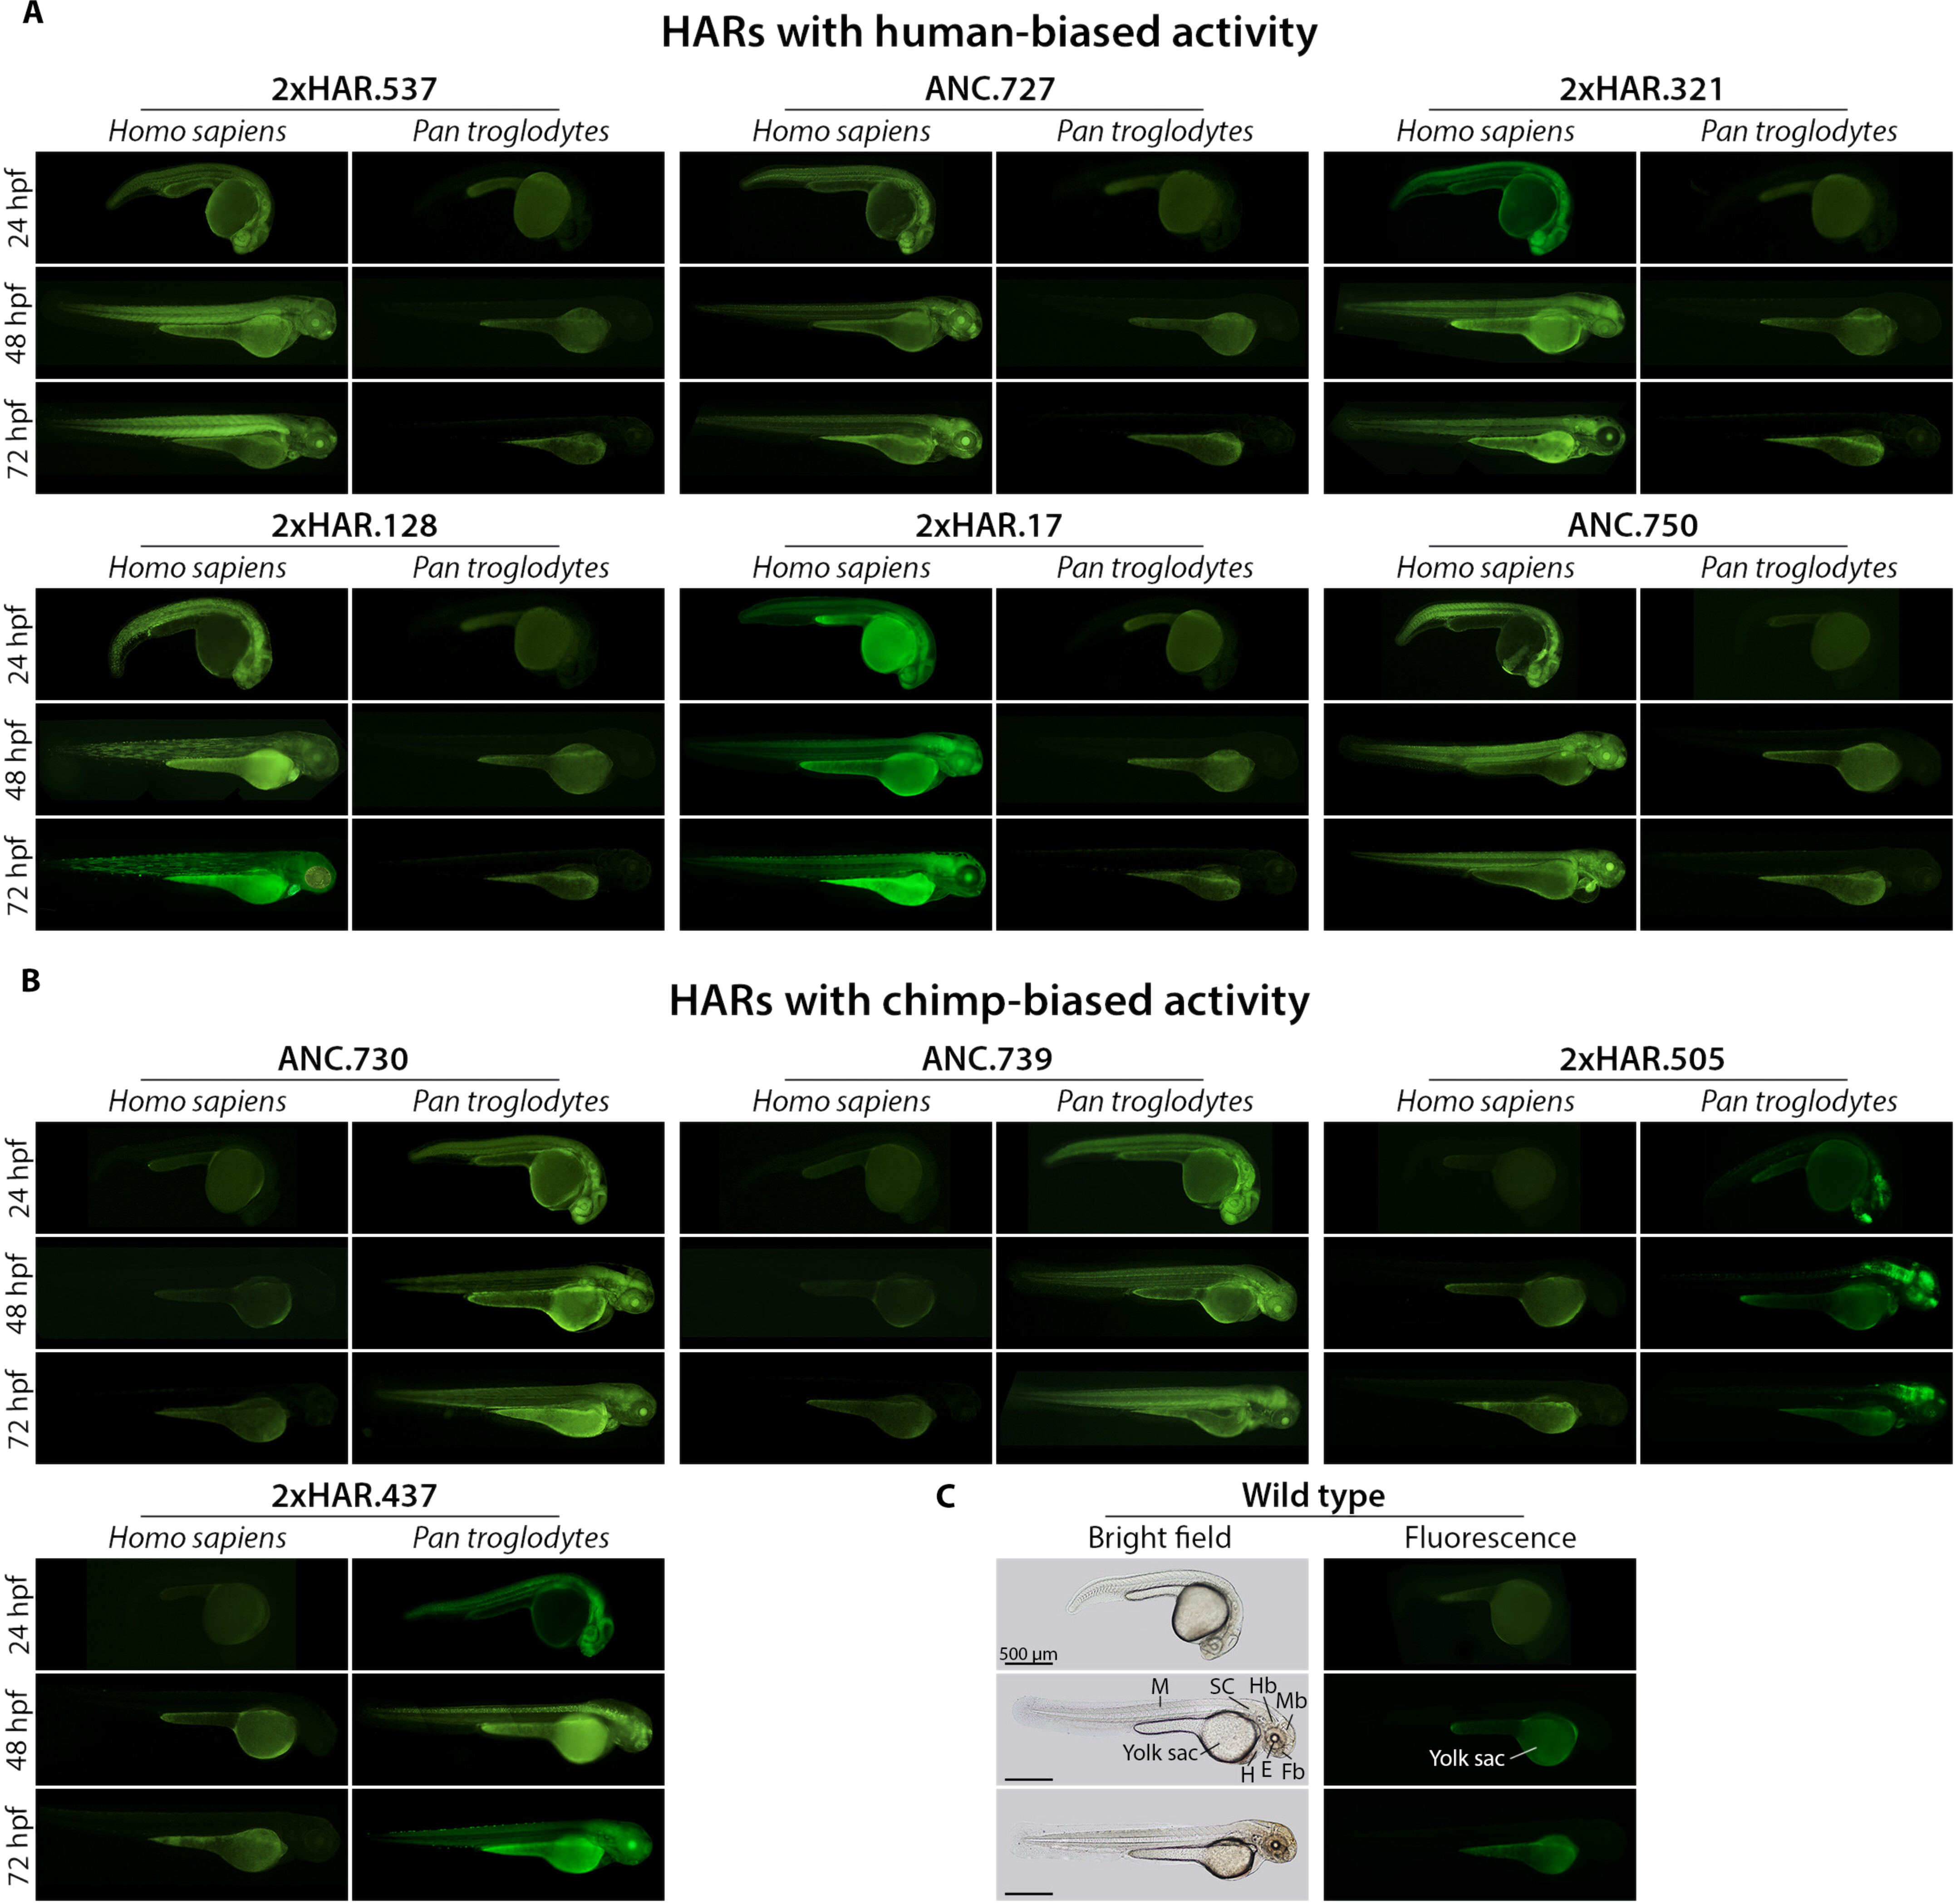
Fig. 2 Comparative expression assays in transgenic zebrafish. RBFOX1-HARs with (A) human-biased and (B) chimp-biased activity. A representative image of the expression pattern driven by the human sequence (Homo sapiens) and its chimpanzee ortholog (Pan troglodytes) is shown at 24, 48, and 72 hpf. (C) Bright-field and fluorescent reference images of wild-type zebrafish. Note that the yolk sac of zebrafish emits autofluorescence. Fb, forebrain; Mb, midbrain; Hb, hindbrain; SC, spinal cord; E, eye; H, heart; M, muscle. All transgenic lines analyzed are included in fig. S3, and higher-magnification images are shown in fig. S4.