
- Title
-
The Oct4-related PouV gene, pou5f3, mediates isthmus development in zebrafish by directly and dynamically regulating pax2a
- Authors
- Maekawa, M., Saito, S., Isobe, D., Takemoto, K., Miura, Y., Dobashi, Y., Yamasu, K.
- Source
- Full text @ Cells Dev
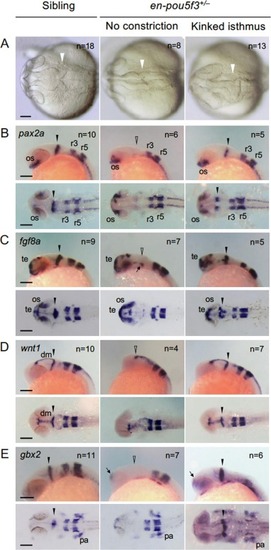
Effects of suppressing pou5f3 on isthmus development. Embryos obtained by crosses of en-pou5f3+/− and wild-type fish were subjected to heat shock at the bud stage and the development of the isthmus was evaluated. A. Morphology of the isthmus at 25 hours post-fertilization (hpf) was assessed, followed by genotyping. Sibling embryos were normal (left), whereas isthmi of en-pou5f3+/− embryos were abrogated with no constriction (middle) or kinking (right). B–E. Expression of pax2a (B), fgf8a (C), wnt1 (D), and gbx2 (E) at 25 hpf in sibling or en-pou5f3+/− embryos with isthmic defects was examined by WISH, followed by genotyping. Except for gbx2 expression in embryos with a kinked isthmus, the expression of egr2b in rhombomeres 3 and 5 (r3 and r5, respectively) was examined in parallel. Solid and open arrowheads mark normal and affected isthmi, respectively. The residual fgf8a expression at the ventral MHB and ectopic expression of gbx2 in the forebrain are marked with arrows. All embryos revealed essentially the same phenotypes among the embryos of the numbers shown at the top-right. dm, dorsal midbrain; os, optic stalk; pa, pharyngeal arch; te, telencephalon. Scale bars, 100 μm. |
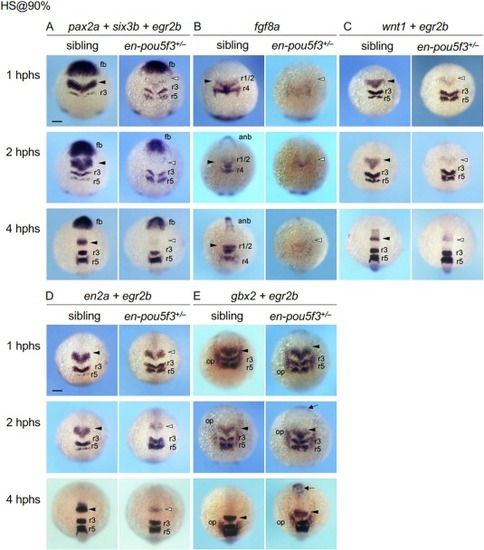
Time course of the expression of MHB-related genes in embryos in which en-pou5f3 was induced at late gastrulation. Embryos obtained by crosses of en-pou5f3+/− and wild-type fish were subjected to heat shock at 90 % epiboly (9 hpf) and examined for the expression of MHB-forming genes (A, pax2a; B, fgf8a; C, wnt1; D, en2a; and E, gbx2) by WISH from 1 to 4 hours post-heat shock (hphs). As references, the expression of six3b in the forebrain and/or egr2b in the hindbrain was assessed. Dorsal views are shown with anterior to the top. Solid and open arrowheads mark normal and reduced expression at the MHB, respectively. Arrows mark the ectopic gbx2 expression in the forebrain. For all marker genes and genotypes, at least 7 embryos were examined, all of which showed the indicated patterns. Additional data are shown in Fig. S1 . anb, anterior neural boundary; fb, forebrain; op, otic placode; r1–5, rhombomeres 1–5. Scale bars, 100 μm. |
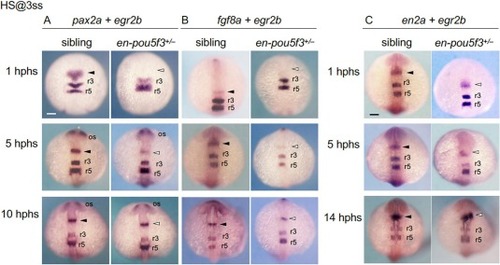
Time course of the expression of MHB-related genes in embryos in which en-pou5f3 was induced during early somitogenesis. Embryos obtained by crosses of en-pou5f3+/− and wild-type fish were subjected to heat shock at 3-ss (11 hpf) and examined for expression of MHB-forming genes (A, pax2a; B, fgf8a; C, en2a) by WISH analysis from 1 to 10/14 hphs. The expression of egr2b in r3 and r5 of the hindbrain was also examined. Dorsal views are shown with the anterior to the top. Solid and open arrowheads mark normal and reduced expression at the MHB, respectively. For all marker genes and genotypes, at least 6 embryos were examined, all of which showed the indicated patterns. Additional data are shown in Fig. S2 . r3/r5, rhombomeres 3 and 5. os, optic stalk. Scale bars, 100 μm. |
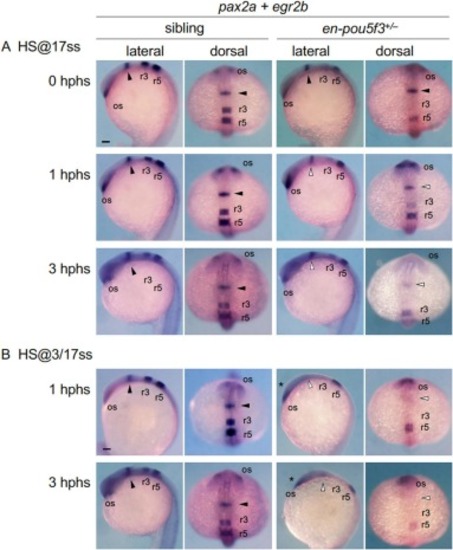
Time course of the expression of pax2a in embryos in which en-pou5f3 was induced later during somitogenesis. Embryos obtained by crosses of en-pou5f3+/− and wild-type fish were subjected to heat shock once at the 17-ss (17.5 hpf) (A) or twice sequentially at the 3-ss (11 hpf) and 17-ss (B), and examined for pax2a expression following heat shock by WISH. The expression of egr2b in r3 and r5 of the hindbrain was also examined. Lateral and dorsal views are shown with the anterior to the top. Solid and open triangles mark normal and reduced expression at the MHB, respectively. Head hypoplasia due to double en-pou5f3 induction is marked with asterisks. For all marker genes and genotypes, at least 7 embryos were examined, all of which showed the indicated patterns. os, optic stalk; r3/r5, rhombomeres 3 and 5. Scale bars, 100 μm. |
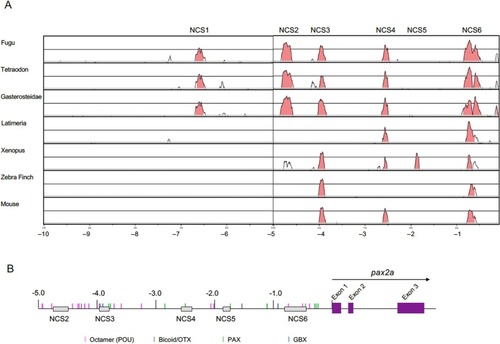
Conservation of the pax2 upstream DNA sequence. (A) The 10.0-kb genomic sequences of the pax2/pax2a genes of the vertebrate species shown at left were compared with that of zebrafish pax2a using the rVISTA software. Abscissas show distances from the start codon (ATG), and the ordinates show percentage sequence identities. Peaks shown in red indicate regions with >50 % identity. The comparison revealed six noncoding conserved sequences (NCSs), termed NCS1–6. (B) Distribution of transcription factor-binding sites predicted using the Match-1.0 Public software. Predicted binding sites ( Fig. S4 ) are shown as short vertical colored bars. (For interpretation of the references to colour in this figure legend, the reader is referred to the web version of this article.) |
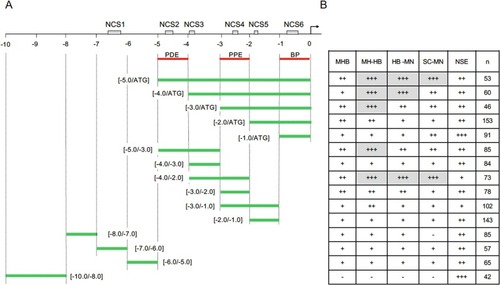
Transcriptional regulatory activity of the pax2a upstream DNA analyzed by in vivo EGFP reporter assay. (A) Schematic view of the pax2a 10-kb upstream DNA with six NCSs ( Fig. 5 ). Below are shown the DNA sub-fragments whose transcriptional regulatory activities were examined by in vivo EGFP reporter assay, in which sub-fragments were co-injected into embryos with hsp-egfp DNA. BP, basic promoter; PDE, pax2a distal enhancer; PPE, pax2a proximal enhancer. (B) EGFP fluorescence in the embryo regions was evaluated and scored at 24 hpf. n, number of embryos examined; HB-MN, hindbrain motor neuron; MHB, midbrain-hindbrain boundary region; MH-HB, broad expression in the midbrain and hindbrain; NSE, non-specific expression; SC-MN, spinal cord motor neuron. ‘–’, ‘+’, ‘++’, and ‘+++’ indicate expression rates of 0%, 1–10%, 11–30%, and 31–70%, respectively (see Table 2 , Table 3 ). Grey boxes indicate relatively high specific expression rates. |
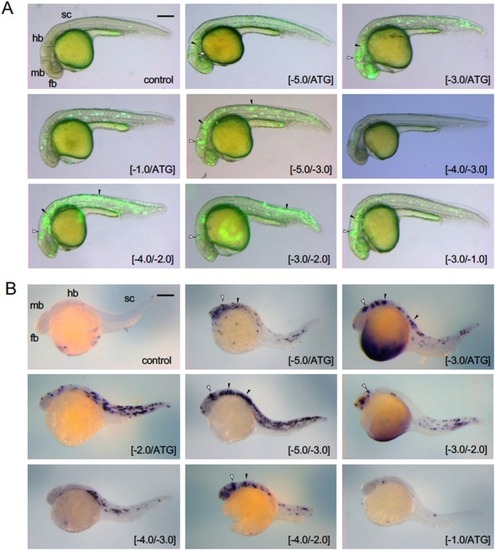
Expression of egfp following co-injection with pax2a upstream DNA. DNA sub-fragments from the upstream DNA of pax2a ( Fig. 6 A) were co-injected with hsp-egfp DNA into fertilized eggs, which were examined at approximately 24 hpf for (A) EGFP fluorescence ( Fig. 6 B) and (B) egfp mRNA visualized by WISH. Co-injected sub-fragments are shown at the bottom right. Reporter expression in the MHB and the ventral hindbrain/spinal cord is marked with open triangles and black triangles, respectively. Regarding WISH, all sub-fragments were examined in at least 10 embryos. Due to the mosaicism of transient transgene expression, the patterns were diverse, but typical data are selected and shown. Additional data showing lack of reporter expression are provided in Fig. S5 . fb, forebrain; hb, hindbrain; mb, midbrain; sc, spinal cord. Scale bar, 250 μm. |
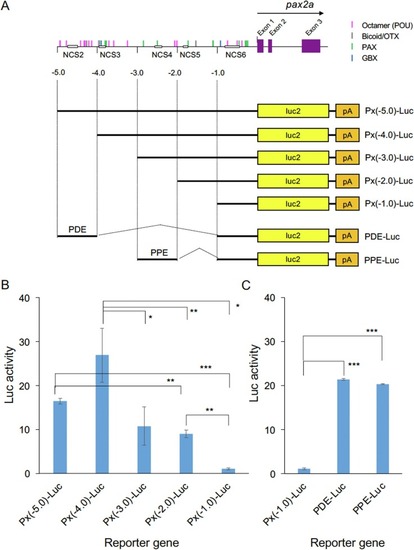
Regulatory activities of pax2a upstream DNA in cultured cells. (A) Luciferase reporter constructs used for reporter assays. Possible transcription factor-binding sites are shown above (cf. Fig. 5 B). The 5.0-kb upstream DNA of pax2a or its subregions was ligated to the luciferase gene, and the constructs were subjected to reporter assays in embryos or HEK293T cells. (B) Expression of the luciferase constructs with deletions in the pax2a upstream DNA in HEK293T cells. (C) Regulatory activities of the PDE and PPE enhancer regions in HEK293T cells using the [−1.0/ATG] region as a promoter. *, p < 0.05; **, p < 0.01; ***, p < 0.001. |
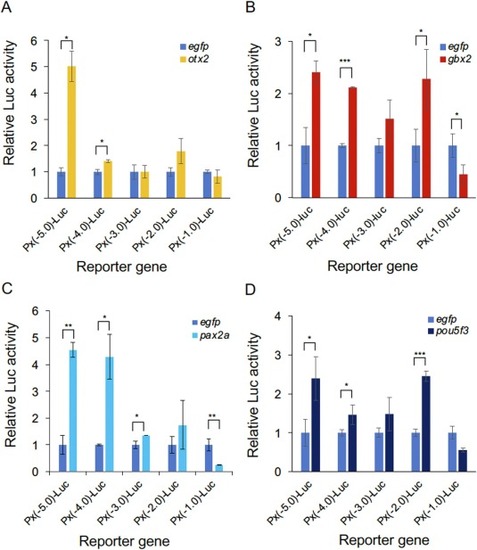
Regulation of pax2a transcription by brain-forming transcription factors. Luciferase constructs with deletions in the pax2a upstream DNA ( Fig. 8 A) were co-transfected into HEK293T cells with transcription factor genes as effectors. (A–D) Ordinates show the expression levels of the indicated luciferase deletion constructs in the presence of brain-forming gene (A, otx2; B, gbx2; C, pax2a; and D, pou5f3) relative to that of Px(−5.0)-Luc co-transfected with egfp as a control effector. Error bars, standard deviations. *, p < 0.05; **, p < 0.01; ***, p < 0.001. |