
Fig. 6
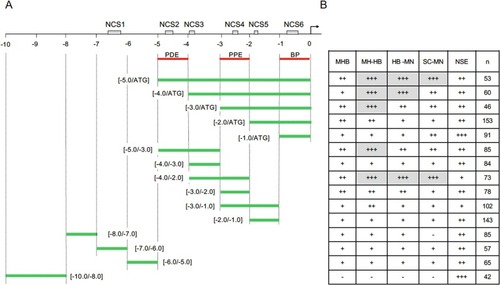
Transcriptional regulatory activity of the pax2a upstream DNA analyzed by in vivo EGFP reporter assay. (A) Schematic view of the pax2a 10-kb upstream DNA with six NCSs ( Fig. 5 ). Below are shown the DNA sub-fragments whose transcriptional regulatory activities were examined by in vivo EGFP reporter assay, in which sub-fragments were co-injected into embryos with hsp-egfp DNA. BP, basic promoter; PDE, pax2a distal enhancer; PPE, pax2a proximal enhancer. (B) EGFP fluorescence in the embryo regions was evaluated and scored at 24 hpf. n, number of embryos examined; HB-MN, hindbrain motor neuron; MHB, midbrain-hindbrain boundary region; MH-HB, broad expression in the midbrain and hindbrain; NSE, non-specific expression; SC-MN, spinal cord motor neuron. ‘–’, ‘+’, ‘++’, and ‘+++’ indicate expression rates of 0%, 1–10%, 11–30%, and 31–70%, respectively (see Table 2 , Table 3 ). Grey boxes indicate relatively high specific expression rates. |