
Fig. 5
- ID
- ZDB-IMAGE-240828-33
- Publication
- Maekawa et al., 2024 - The Oct4-related PouV gene, pou5f3, mediates isthmus development in zebrafish by directly and dynamically regulating pax2a
- All Figures
- Figures for Maekawa et al., 2024
|
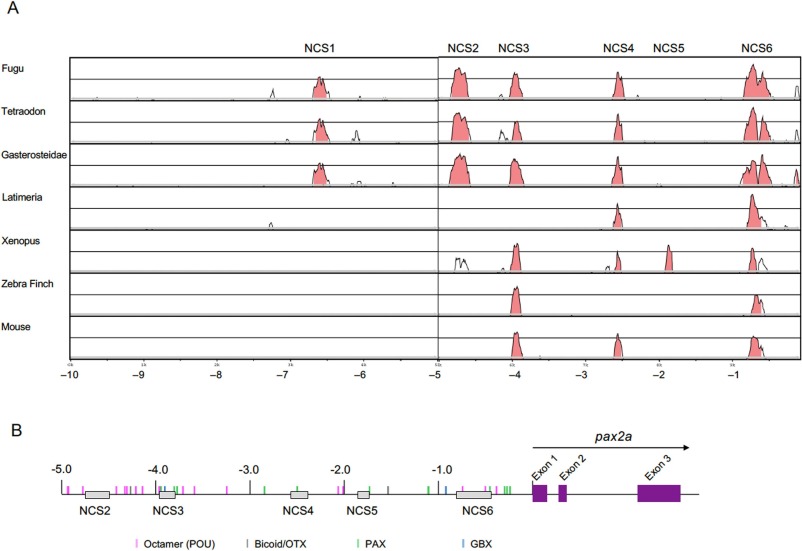
Fig. 5 Conservation of the pax2 upstream DNA sequence. (A) The 10.0-kb genomic sequences of the pax2/pax2a genes of the vertebrate species shown at left were compared with that of zebrafish pax2a using the rVISTA software. Abscissas show distances from the start codon (ATG), and the ordinates show percentage sequence identities. Peaks shown in red indicate regions with >50 % identity. The comparison revealed six noncoding conserved sequences (NCSs), termed NCS1–6. (B) Distribution of transcription factor-binding sites predicted using the Match-1.0 Public software. Predicted binding sites ( Fig. S4 ) are shown as short vertical colored bars. (For interpretation of the references to colour in this figure legend, the reader is referred to the web version of this article.)