FIGURE SUMMARY
Title

Zebrafish as a Human Muscle Model for Studying Age-Dependent Sarcopenia and Frailty

Authors
Aranda-Martínez, P., Sayed, R.K.A., Fernández-Martínez, J., Ramírez-Casas, Y., Yang, Y., Escames, G., Acuña-Castroviejo, D.
Source
Full text @ Int. J. Mol. Sci.

Increase in frailty index with age. (A) Total length (cm) and (B) total weight (g) increased in an age-dependent manner. (C) BMI (g/cm2) increased significantly in 30- and 60-month groups. (D) Total distance (cm) decreased significantly in 30- and 60-month groups with respect to the younger groups. (E) Maximum speed (cm/s) underwent a tendency to decrease, being significant in the oldest group with respect to the 2 and 10 month-groups. (F) Mean speed (cm/s) showed a prominent decrease in the 30-month group and remained in the 60-month group relative to the young groups. (G) The groups of 2 and 10 months had a frailty index of 0. However, at 30 months, we observed an increase, which became significant at 60 months. Data are presented as mean ± SEM (n = 8–10 animals/group). * p < 0.05 vs. 2 mo; ** p < 0.01 vs. 2 mo; *** p < 0.001 vs. 2 mo; # p < 0.05 vs. 10 mo; ## p < 0.01 vs. 10 mo; ### p < 0.001 vs. 10 mo; $ p < 0.05 vs. 30 mo; $$ p < 0.01 vs. 30 mo; $$$ p < 0.001 vs. 30 mo. One-way ANOVA with a Tukey’s post hoc test.

Histological and morphometric changes of zebrafish skeletal muscle. (A) Light microscopy images of longitudinal sections stained with hematoxylin and eosin (H&E) displayed a normal structure in the 2- and 10-month groups, whereas in the 30-month group, we observed hypertrophy and, at 60 months, muscle disorganization and atrophy. (B) The number of myocytes decreased with age. (C) The width of the myocytes increased at 10 and 30 months. (D) Light microscopy images of longitudinal sections stained with Van Gieson (VG) highlighted collagen infiltrations in red. (E) Collagen content exhibited a significant increase in 60-month-old fish. (A,D): scale bar = 100 μm (above) and 50 μm (below). Data are presented as mean ± SEM (n = 4 animals/group). * p < 0.05 vs. 2 mo; *** p < 0.001 vs. 2 mo; ## p < 0.01 vs. 10 mo; ### p < 0.001 vs. 10 mo; $$ p < 0.01 vs. 30 mo; $$$ p < 0.001 vs. 30 mo. One-way ANOVA with a Tukey’s post hoc test.

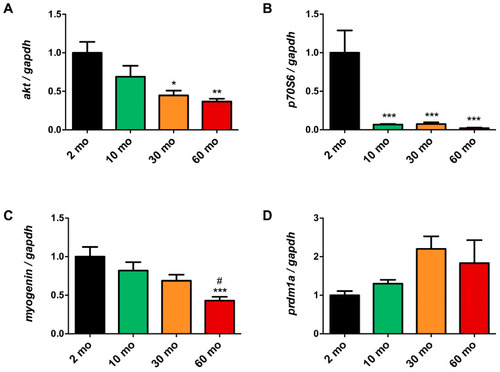
Disruption of muscle growth and differentiation pathways during aging. (A) akt expression showed an age-dependent decrease. (B) p70s6k was significantly reduced as early as 10 months of age. (C) Myogenin expression demonstrated a progressive reduction, with statistical significance observed at 60 months. (D) prdm1a increased at 30 and 60 months but not statistically significantly. Data are presented as mean ± SEM (n = 6–8 animals/group). * p < 0.05 vs. 2 mo; ** p < 0.01 vs. 2 mo; *** p < 0.001 vs. 2 mo; # p < 0.05 vs. 10 mo. One-way ANOVA with a Tukey’s post hoc test.

Changes in muscle ultrastructure and mitochondria. (A) Electron micrograph of a longitudinal section of the skeletal muscle. (a) 2-month-old fish showed myofibrils (Mf), isotropic bands (I), anisotropic bands and (A) sarcomeres between each two successive Z-Line (Z). (b) sarcoplasmic reticulum (SR), mitochondria (M) and an area of ill-developed myofibrils was detected (black asterisk). (c) the triad region, formed by transverse tubules (T and white arrow) and terminal cisterns (C), was evident. The nucleus (N) was peripherally located under the sarcolemma (black arrow). (d) At an age of 10 months old, we observed normal myofibrils (Mf), sarcoplasmic reticulum (SR), and mitochondria (M), with the presence of vacuolated mitochondria (white arrow). (e) It was showed vacuoles (V), glycogen droplets (g), and (f) peripherally positioned nucleus (N) under the sarcolemma (black arrow), and interstitial tissues (In). (g) 30-month-old fishes presented normal myofibrils (Mf), swollen sarcoplasmic reticulum (SR), and hypertrophied mitochondria (M), (h) with the presence of indistinct mitochondrial cristae (white asterisk), vacuoles (V), and (i) shrinkage of nucleus (N). (jl) The 60-month-old group showed disorganized myofibrils (Mf) and mitochondria (M) with the presence of damaged ones and others with damaged and/or disorganized cristae as well as vacuoles (V). Scale bar = 1 μm. (B) Sarcomere length decreased with age. (C) The number of IFMs and (D) their CSA decreased significantly at 60 months of age. (E) The number of SSMs increased in the 30-month group. (F) No difference was found in the CSA of SSM. (G) Band A length increased in 60-month-old fish, (H) as did the H band. (I) The length of the I band decreased in the 60-month group. (J) Mitochondrial damage increased sharply in the older group. Data are presented as mean ± SEM (n = 4 animals/group). * p < 0.05 vs. 2 mo; ** p < 0.01 vs. 2 mo; *** p < 0.001 vs. 2 mo; # p < 0.05 vs. 10 mo; ## p < 0.01 vs. 10 mo; ### p < 0.001 vs. 10 mo; $$ p < 0.01 vs. 30 mo; $$$ p < 0.001 vs. 30 mo. One-way ANOVA with a Tukey’s post hoc test.

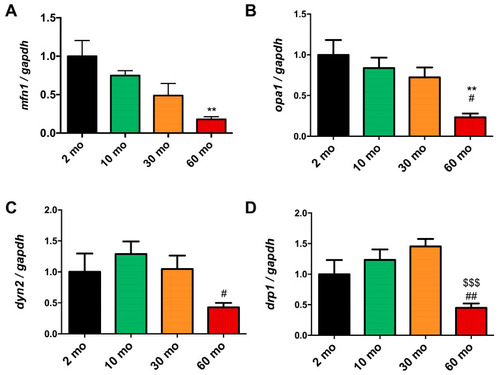
Reduction in mitochondrial dynamics in old fish. (A) The expression of mfn1 and (B) opa1 exhibited a decreasing trend with age, becoming significant at 60 months. (C) dyn2 expression increased at 10 months but also significantly decreased at 60 months. (D) The expression of drp1 increased at 10 and 30 months but showed a substantial decrease at 60 months. Data are presented as mean ± SEM (n = 6–8 animals/group). ** p < 0.01 vs. 2 mo; # p < 0.05 vs. 10 mo; ## p < 0.01 vs. 10 mo; $$$ p < 0.001 vs. 30 mo. One-way ANOVA with a Tukey’s post hoc test.

Loss of mitochondria with age. (A) Confocal microscopy images showing the nuclei labeled with DAPI and the mitochondria with GFP in the 2-, 10-, 30-, and 60-month groups. (B) The fish at 2 and 10 months exhibited a high GFP intensity, which decreased significantly at 30 and 60 months. Data are presented as mean ± SEM (n = 4 animals/group). * p < 0.05 vs. 2 mo; # p < 0.05 vs. 10 mo. Unpaired t test.

Acknowledgments
This image is the copyrighted work of the attributed author or publisher, and ZFIN has permission only to display this image to its users. Additional permissions should be obtained from the applicable author or publisher of the image. Full text @ Int. J. Mol. Sci.