IMAGE

Figure 1

ID
ZDB-IMAGE-240620-275
Source
Figures for Aranda-Martínez et al., 2024
Image
Figure Caption

Figure 1

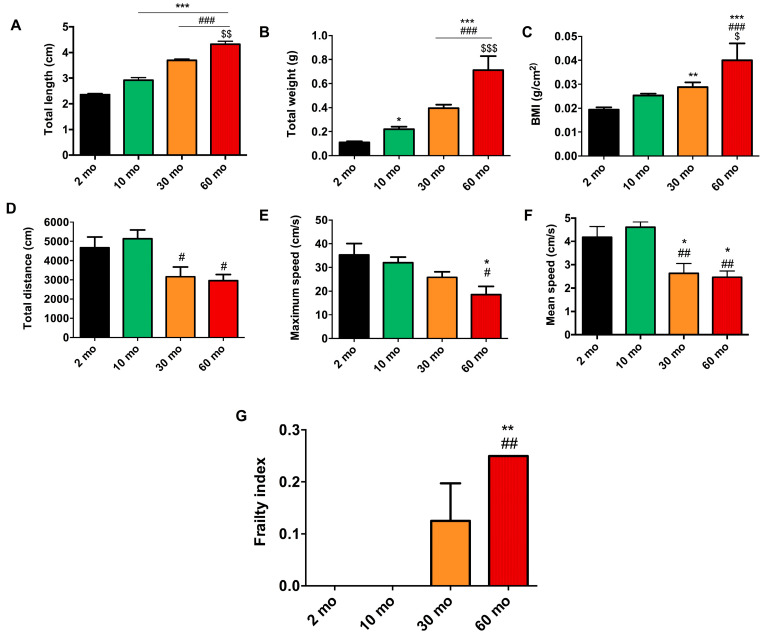
Increase in frailty index with age. (A) Total length (cm) and (B) total weight (g) increased in an age-dependent manner. (C) BMI (g/cm2) increased significantly in 30- and 60-month groups. (D) Total distance (cm) decreased significantly in 30- and 60-month groups with respect to the younger groups. (E) Maximum speed (cm/s) underwent a tendency to decrease, being significant in the oldest group with respect to the 2 and 10 month-groups. (F) Mean speed (cm/s) showed a prominent decrease in the 30-month group and remained in the 60-month group relative to the young groups. (G) The groups of 2 and 10 months had a frailty index of 0. However, at 30 months, we observed an increase, which became significant at 60 months. Data are presented as mean ± SEM (n = 8–10 animals/group). * p < 0.05 vs. 2 mo; ** p < 0.01 vs. 2 mo; *** p < 0.001 vs. 2 mo; # p < 0.05 vs. 10 mo; ## p < 0.01 vs. 10 mo; ### p < 0.001 vs. 10 mo; $ p < 0.05 vs. 30 mo; $$ p < 0.01 vs. 30 mo; $$$ p < 0.001 vs. 30 mo. One-way ANOVA with a Tukey’s post hoc test.

Acknowledgments
This image is the copyrighted work of the attributed author or publisher, and ZFIN has permission only to display this image to its users. Additional permissions should be obtained from the applicable author or publisher of the image. Full text @ Int. J. Mol. Sci.