FIGURE SUMMARY
Title

Ciliogenesis defects after neurulation impact brain development and neuronal activity in larval zebrafish

Authors
D'Gama, P.P., Jeong, I., Nygård, A.M., Trinh, A.T., Yaksi, E., Jurisch-Yaksi, N.
Source
Full text @ iScience

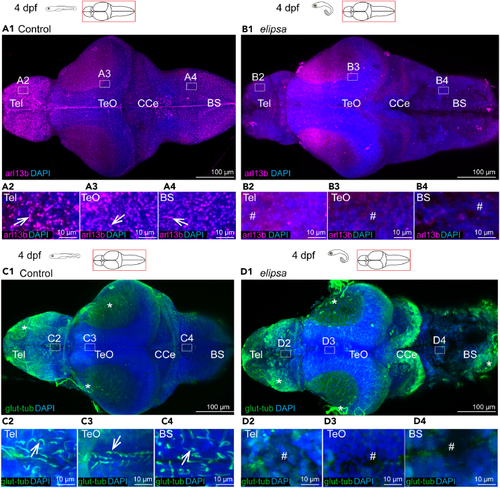
Loss of primary and motile cilia in the elipsa mutant larval brain

(A1–A4 and B1–B4) Staining of dissected 4 dpf brains with arl13b antibody to stain all cilia in the brain, n = 8 controls and 9 mutants. A1 At 4 dpf, arl13b stained cilia were located all over the brain, represented in insets drawn in the telencephalon (A2), optic tectum (A3) and brainstem (A4).

(B1) In the elipsa mutants, arl13b-expressing cilia were absent in the entire brain, as represented by insets drawn in the telencephalon (B2), optic tectum (B3), and brain stem (B4). (C1–C4 and D1–D4) Staining of dissected 4 dpf brains with glutamylated tubulin used to identify motile cilia, n = 5.

(C1) At 4 dpf, single glutamylated tubulin-positive cilia were present in the forebrain choroid plexus (C2), on the dorsal roof and ventral part (C3) of the tectal/diencephalic ventricle and in the rhombencephalon choroid plexus (C4).

(D1) In elipsa mutant, glutamylated tubulin-positive cilia were absent in the telencephalon (D2), optic tectum (D3), and brain stem (D4). Tel, Telencephalon; Teo, Optic Tectum; CCe, Corpus Cerebelli; BS, Brain stem. Cilia loss indicated by # symbol and nonspecific signal from glutamylated tubulin is represented by ∗ symbol.

See also Figures S1 and S2.

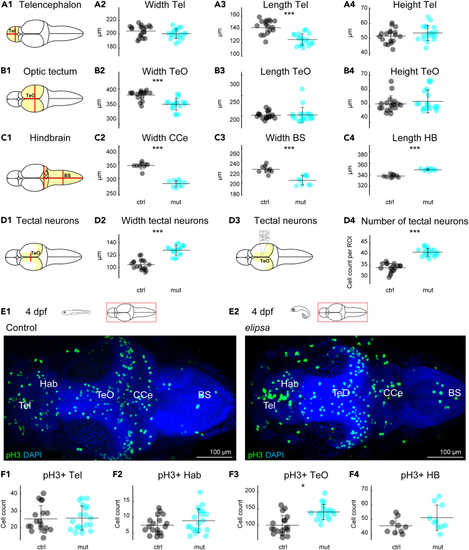
Cilia defects lead to abnormal brain size and alters cell proliferation in the optic tectum

(A1–D4) Quantification of brain morphology of 4 dpf larval brains for control (black) and elipsa mutants (cyan). Schematic representation of the measurements for (A1) telencephalon, (B1) optic tectum, (C1) hindbrain regions and (D1) tectal neurons. Brain size was estimated by measuring the width, length, and height of telencephalon (A2, A3, A4), optic tectum (B2, B3, B4), width of CCe (C2), width of BS (C3), length of hindbrain (C4), and the width (D2) and number of neurons in a defined region of interest (D3) (ROI of 36 × 28μm) (D4) of tectal neurons. Controls are in black and elipsa mutants in cyan. n = 18 controls and 19 mutants for A2, A3, A4, B2, B3, B4, D2, D4. n = 9 controls and 10 mutants for C2, C3 and C4.

(E1 and E2) staining for mitotic cells using an anti-pH3 antibody.

(F1–F4) Cell count for pH3 positive cells (pH3+) in telencephalon (F1), habenula (F2), optic tectum (F3) and hindbrain (F4). ∗:
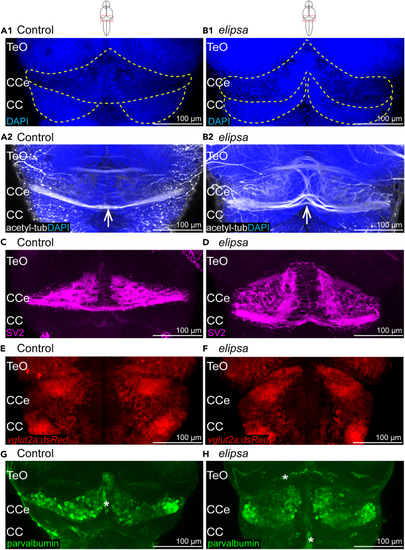
 p < 0.05, ∗∗∗: p < 0.001 according to Wilcoxon Rank-Sum test. Mean ± SD (standard deviation) is indicated on scatterplots. Tel, Telencephalon; Teo, Optic Tectum; BS, Brain stem; CCe, Corpus Cerebelli; HB, Hindbrain.

Cerebellar defects in 4 days old elipsa mutants

(A1–B1) Cell nucleus stained using dapi in control (A1) and elipsa mutant (B1). Differences in morphology indicated by yellow lines. n = 7 controls and 7 mutants. (A2–B2) Larvae immunostained with anti-acetylated tubulin to stain axonal bundles (indicated with white arrow) in control (A2) and elipsa mutant (B2). n = 7 controls and 7 mutants.

(C and D) Larvae immunostained with the presynaptic vesicle marker SV2 in control (C) and elipsa mutant (D). n = 6 controls and 6 mutants (E and F) Expression of glutamatergic cells in Tg(vglut2a:dsRed) transgenic zebrafish in control (E) and elipsa mutant (F). n = 8 controls and 8 mutants (G and H) Immunostaining of cerebellar Purkinje neurons using anti-parvalbumin antibody in control (G) and elipsa mutant (H). n = 10 controls and 8 mutants. ∗ indicates nonspecific signal from blood cells and vasculature. Number of Purkinje cells in control (mean ± standard deviation): 83.87 ± 5.22 cells, in mutants: 58 ± 6.8 cells, p-value 4,6965E-06 according to Student’s t test. Teo, Optic Tectum; CCe, Corpus Cerebelli; CC, Crista cerebralis.

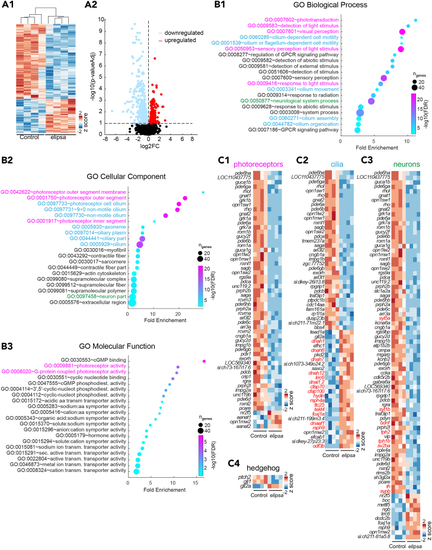
Transcriptomic analysis reveals altered expression of genes involved in phototransduction

(A1) Heatmap of expression of differentially expressed genes (DEGs) from control and elipsa 4dpf whole larvae (n = 4 RNA preparation obtained from circa 30 elipsa and sibling controls) shown as Z score of log2-normalized read counts. Increased expression is represented with red and decreased expression with blue. A total of 702 (220 upregulated and 482 downregulated) DEGs were identified based on a threshold of p-value adjusted of 0.1.

(A2) Volcano plot showing the DEGs in elipsa as compared with control. The horizontal dotted line indicates the adjusted p-value of 0.1. The vertical dotted line separate upregulated (red) and downregulated (blue) DEGs.

(B) Top 20 Gene Ontology (GO) biological process (B1) cellular component (B2) and molecular function (B3). Genes associated with GO terms related to phototransduction (magenta), cilia (blue) and neuronal process (green) are represented in (C1–C3).

(C) Heatmaps showing expression of DEGs (represented as Z score of log2-normalized read counts) associated with (C1) photoreceptor and light detection GO terms (magenta highlights in B1-B3), (C2) cilia GO terms (blue highlights in B1-B2), (C3) neuronal process (green highlight in B1-B2), and (C4) hedgehog signaling (receptors smo and ptch1-2 and transcription factors gli1-3). Red highlights show genes associated with motile cilia function in (C2) and genes of interest in (C3).

See also Figure S3, Tables S1 and S2.

elipsa mutants display morphological defects of the photoreceptor outer segments and no retinal electrical activity

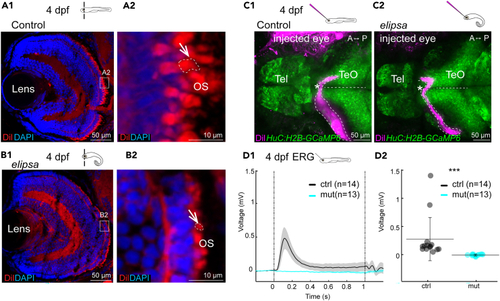
(A1–B2) DiI staining of 4 dpf retina cryosection to stain the outer segments. Section through the whole retina or the photoreceptor layer of a representative control (A1-A2) and elipsa (B1-B2). Shortened outer segments (OS) are indicated using arrow and dashed lines. n = 10 controls and 12 mutants. (C1-C2) DiI injection into the eye at 4dpf to stain the axonal connections (represented in dotted lines) which cross the midline and innervate the contralateral optic tectum. Here is shown a representative control (C1) and elipsa (C2). Note that in the elipsa mutant the axonal tract goes posterior prior to returning to the optic chiasm. ∗ indicates region of optic chiasm. n = 9 controls and 8 mutants. See Figure S4 for additional examples.

(D1-D2) Electroretinography (ERG) recordings in a 4 dpf retina. D1 Average response of electrical activity (+/− standard error of the mean as the shaded region) to 1 s light stimulation for control (black) and mutant (cyan). D2 Average electrical responses for the 200 msec following the light ON stimulus for all control fish (black) and elipsa mutant (cyan) showing no activity in the mutant. ∗∗∗: p < 0.001 according to Wilcoxon Rank-Sum test. Mean+/− standard deviation is indicated on scatterplots. n = 14 controls and 13 mutants. Tel, Telencephalon; Teo, Optic Tectum. See also Figure S4.

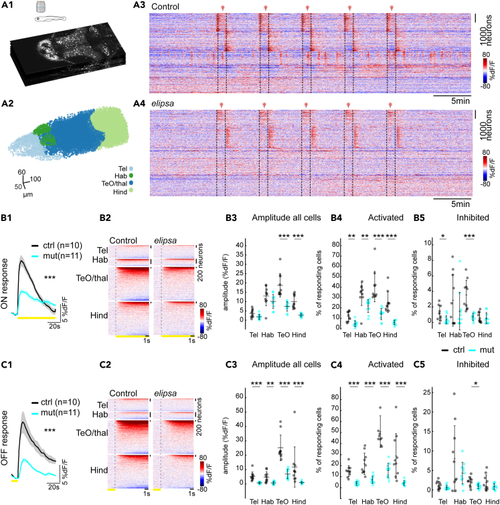
Reduced photic-induced neural activity in the brain of elipsa mutants

(A1) Optical sections of multiplane recording of a transgenic zebrafish larva expressing nuclear GcaMP6s in all neurons Tg(elavl3:H2B-GcaMP6s)jf7Tg. (A2) Segmented nuclei from different brain regions, which were identified based on anatomical landmarks, are color coded. (A3-A4) Neuronal activity represented as change of fluorescence (dF/F) in one representative control and mutant larvae. Traces were sorted based on their activity using k-means clustering (warm color represents higher calcium signals).

(B1, C1) Neural responses to light stimulation for control (black) and mutant (cyan) averaged over 5 trials of photic stimulations for ON (B1) and OFF (C1) response conditions (+/− standard error of mean as the shaded region trace). (B2, C2) Activity of neurons per brain regions during ON (B2) and OFF response (C2) for representative examples (warm color represents higher calcium signals). (B3, C3) Average amplitude of all cells during ON (B3) and OFF (C3) response for control (black) and mutant (cyan), amplitude was significantly reduced in TeO and Hind regions for ON response and all brain regions for OFF response. (B4, C4 and B5, C5) % of cells that are activated during ON (B4) and OFF response (C4) and inhibited during ON (B5) and OFF response (C5). ∗: p < 0.05, ∗∗: p < 0.01, ∗∗∗: p < 0.001 according to Wilcoxon Rank-Sum test. Mean+/− standard deviation is indicated on scatterplots. n = 10 controls and 11 mutants, control (black) and mutant (cyan). Tel, Telencephalon; TeO, Optic Tectum; BS, Brainstem; Hind, Hindbrain.

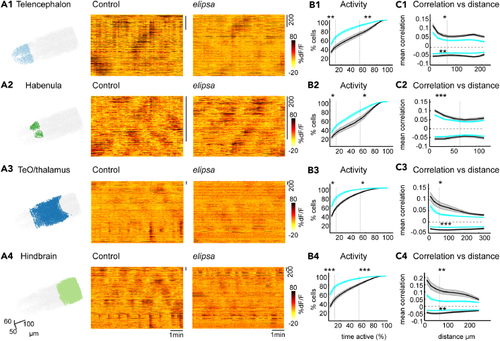
Reduced ongoing spontaneous activity and correlation in the elipsa mutants

(A1–A4) Three-dimensional representation of segmented neurons and their activity for one representative control and elipsa for the Telencephalon (A1), Habenula (A2), TeO/thalamus (A3) and Hindbrain (A4). Dark color represents higher dF/F signals.

(B1–B4) Average cumulative frequency distribution graphs showing the percentage of activity of neurons in Telencephalon (B1), Habenula (B2), TeO/thalamus (B3) and Hindbrain (B4), for control (black) and elipsa (cyan). (+/− standard error of mean as the shaded area). Dotted lines indicate activity below 10% and above 50%.

(C1–C4) Mean Pearson’s correlation versus distance graphs showing positive and negative correlation between cells in Telencephalon (C1), Habenula (C2), TeO/thalamus (C3) and Hindbrain (C4), for control (black) and mutant (cyan). Significance tests for the correlation were computed for cells located within 60 μm indicated by the dotted line on the X axis. ∗: p < 0.05, ∗∗: p < 0.01, ∗∗∗: p < 0.001 according to Wilcoxon Rank-Sum test. n = 10 controls and 11 mutants.

See also Figure S5.

Acknowledgments
This image is the copyrighted work of the attributed author or publisher, and ZFIN has permission only to display this image to its users. Additional permissions should be obtained from the applicable author or publisher of the image. Full text @ iScience