IMAGE

Figure 5

ID
ZDB-IMAGE-240613-46
Source
Figures for D'Gama et al., 2024
Image
Figure Caption

Figure 5

elipsa mutants display morphological defects of the photoreceptor outer segments and no retinal electrical activity

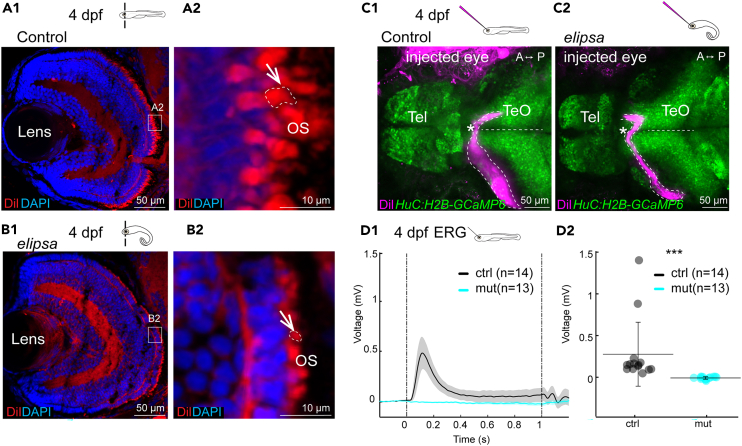
(A1–B2) DiI staining of 4 dpf retina cryosection to stain the outer segments. Section through the whole retina or the photoreceptor layer of a representative control (A1-A2) and elipsa (B1-B2). Shortened outer segments (OS) are indicated using arrow and dashed lines. n = 10 controls and 12 mutants. (C1-C2) DiI injection into the eye at 4dpf to stain the axonal connections (represented in dotted lines) which cross the midline and innervate the contralateral optic tectum. Here is shown a representative control (C1) and elipsa (C2). Note that in the elipsa mutant the axonal tract goes posterior prior to returning to the optic chiasm. ∗ indicates region of optic chiasm. n = 9 controls and 8 mutants. See Figure S4 for additional examples.

(D1-D2) Electroretinography (ERG) recordings in a 4 dpf retina. D1 Average response of electrical activity (+/− standard error of the mean as the shaded region) to 1 s light stimulation for control (black) and mutant (cyan). D2 Average electrical responses for the 200 msec following the light ON stimulus for all control fish (black) and elipsa mutant (cyan) showing no activity in the mutant. ∗∗∗: p < 0.001 according to Wilcoxon Rank-Sum test. Mean+/− standard deviation is indicated on scatterplots. n = 14 controls and 13 mutants. Tel, Telencephalon; Teo, Optic Tectum. See also Figure S4.

Acknowledgments
This image is the copyrighted work of the attributed author or publisher, and ZFIN has permission only to display this image to its users. Additional permissions should be obtained from the applicable author or publisher of the image. Full text @ iScience